- About Us

- Our Services
- Your Industry
- Resources
- News & Blog
A solar project is only as reliable as the modules going into it. Yet two of the most damaging defect types — micro-cracks inside silicon cells and power output that quietly misses its rated specification — are completely invisible to a standard visual inspection. They pass every eye-check at the factory, get loaded into containers, and only reveal themselves months later as underperforming strings, hot spots, or warranty disputes. For buyers sourcing PV modules from Chinese manufacturers, adding electroluminescence (EL) testing and IV curve flash testing to a pre-shipment inspection is the difference between catching these problems at the factory gate and inheriting them in the field.
Key Takeaways
- EL testing uses infrared imaging to make micro-cracks and broken gridlines visible inside silicon cells — defects that visual inspection and IV curve testing alone cannot detect.
- IV curve flash testing at Standard Test Conditions (STC) verifies that each sampled module's Pmax, Voc, and Isc match the manufacturer's datasheet within the agreed tolerance — typically +3%/−0%.
- Combining EL imaging with flash testing during pre-shipment inspection gives buyers structural integrity data plus electrical performance data before goods leave the factory, when corrective action is still possible.
Why Standard Visual Inspection Is Not Enough for PV Modules
The Hidden Defect Problem
Visual inspection catches obvious cosmetic issues: frame damage, glass scratches, delamination bubbles, junction box misalignment. These are real defects worth catching. But the two defect types that most directly affect long-term energy yield — micro-cracks in silicon cells and sub-specification power output — exist entirely beneath the surface. A silicon cell with a crack running at 45° from a gridline looks identical to a healthy cell in normal light. A module measuring 395 W instead of its rated 400 W looks identical on a pallet.
Industry data from field inspections of installed solar plants consistently shows that micro-cracks are present in most commercial installations. The critical variable is not whether cracks exist, but how severe they are and whether they are propagating. Catching severe micro-cracks before shipment protects buyers from discovering underperforming modules after installation — at which point the logistics of replacement are far more expensive than the inspection cost.
Where Defects Enter the Supply Chain
Micro-cracks in silicon wafers can originate at multiple points: during cell sawing, during lamination, during frame assembly, or — critically — during packing and handling before shipment. The last category is particularly important for third-party pre-shipment inspection, because it captures damage that the manufacturer's own end-of-line EL test (conducted before packing) would not have seen. A module that passed factory EL testing can develop new cracks during palletization, rough handling, or compression from improper stacking.
Power output discrepancies have a different origin. Flash tester calibration drift at the factory, batch-to-batch cell binning variation, and selective reporting of flash test data are all documented sources of Pmax shortfalls that third-party IV testing is specifically designed to detect.
EL Testing: How It Works and What It Finds
The Electroluminescence Principle
When a forward-bias current is applied to a PV cell, the semiconductor material emits light in the near-infrared spectrum — the same electroluminescence phenomenon that underlies LED operation, running in reverse. A high-resolution CCD or InGaAs camera captures this emitted light in a darkened environment. Healthy, electrically connected cell material glows uniformly bright. Areas that are cracked, disconnected, or inactive appear as dark regions against the bright background — a direct map of the electrical connectivity within the module.
The test is non-destructive. No material is stressed beyond normal operating conditions, and the module is fully functional after testing. For pre-shipment inspection purposes, the testing is conducted in a darkened area at the factory or in a mobile EL enclosure, with a current injection level approximately equal to the module's Isc at STC.
Defect Types EL Testing Detects
Micro-cracks appear as dark linear or branching features within cell areas. Their severity classification matters: a hairline crack that does not interrupt current flow may have minimal immediate power impact, while a crack that crosses multiple busbars and creates an isolated inactive cell area is a rejection-level defect. Industry inspection criteria maintain detailed crack classification schemes that specify pass/fail thresholds by crack type and area affected per cell.
Broken gridlines appear as dark bands across a cell, indicating that a current-carrying finger has separated. Unlike micro-cracks, broken gridlines typically have an immediate measurable power impact. Bus bar contact failures show as broad dark bands where the cell's busbar has lost contact with the ribbon interconnect — a soldering defect that causes significant mismatch within a series string. Potential Induced Degradation (PID) manifests as dark peripheral regions across cells, indicating sodium ion migration through the encapsulant that reduces shunt resistance. Inactive cell areas from any cause appear as uniformly dark zones with sharp boundaries against active cell area.
EL Testing Limitations Buyers Should Understand
EL testing detects structural and electrical connectivity defects. It does not directly measure power output. A module with a subtle power shortfall caused by cell binning variation or calibration drift on the manufacturer's flash tester will show a normal EL image. This is why EL testing and IV curve flash testing are complementary, not substitutes for each other. EL finds structural problems; IV curve testing finds power problems.
IV Curve Flash Testing: Verifying Rated Power at STC
What a Flash Test Measures
An IV curve flash test exposes a module to a calibrated pulse of simulated sunlight at 1000 W/m² irradiance, AM 1.5 spectrum, and 25°C cell temperature — the Standard Test Conditions (STC) defined in IEC 60904-1 and used universally in module datasheets. During the flash pulse, a variable electronic load sweeps across the module's full current-voltage range, tracing the complete IV curve in real time. From the IV curve, the flash tester calculates the key electrical parameters: Pmax (maximum power), Voc (open-circuit voltage), Isc (short-circuit current), Vmpp, Impp, and Fill Factor. These values are compared against the manufacturer's datasheet specifications to determine whether the module meets its stated performance.
Pass/Fail Criteria and Power Tolerance
The standard power tolerance accepted by buyers for pre-shipment inspection is typically +3%/−0% relative to the module's nominal Pmax rating. A module rated at 400 W must measure between 400 W and 412 W. Any module measuring below 400 W fails, even if only by 1 W. This tolerance requirement is buyer-specified and must be agreed upon in the purchase contract before inspection — it is not automatically enforced by the manufacturer's own shipping standards. Many manufacturers ship to ±3% tolerance, meaning a 400 W module could legally ship at 388 W under their internal standard. Third-party IV testing with a buyer-specified +3%/−0% tolerance closes this gap.
Beyond Pmax, flash testers also flag abnormal IV curve shapes. A stepped or irregular curve indicates current mismatch between cell strings — often caused by cracked cells or bypass diode issues. A low Fill Factor suggests elevated series resistance, which can indicate poor soldering quality or degraded contacts that will worsen over the module's operational life.
AQL Sampling for IV Curve Testing
Full 100% flash testing of a large shipment is time-intensive and not cost-effective for most pre-shipment inspections. The standard approach uses AQL (Acceptance Quality Limit) sampling per ISO 2859-1. For a shipment of 1,000 modules, General Inspection Level II at AQL 2.5 for major defects requires a sample of approximately 125 modules, with an acceptance number of 7 — meaning more than 7 below-tolerance modules in the sample triggers a lot hold. Buyers should specify the AQL level and sample size in their purchase agreement. For high-value projects or situations where a specific manufacturer has a history of power shortfalls, tightening to AQL 1.0 increases detection confidence at the cost of a larger sample.
Combining EL and IV Testing in a Pre-Shipment Inspection Workflow
Recommended Inspection Sequence
When both EL and IV testing are included in a pre-shipment inspection, the sequence matters for efficiency and data integrity. The recommended workflow begins with visual inspection to remove obviously damaged modules from the sample before they consume EL or IV test time. EL testing is conducted next, identifying structurally compromised modules. IV curve flash testing follows EL, confirming power output on the structurally accepted modules. Container loading supervision closes the process by verifying that only inspected and approved modules are loaded.
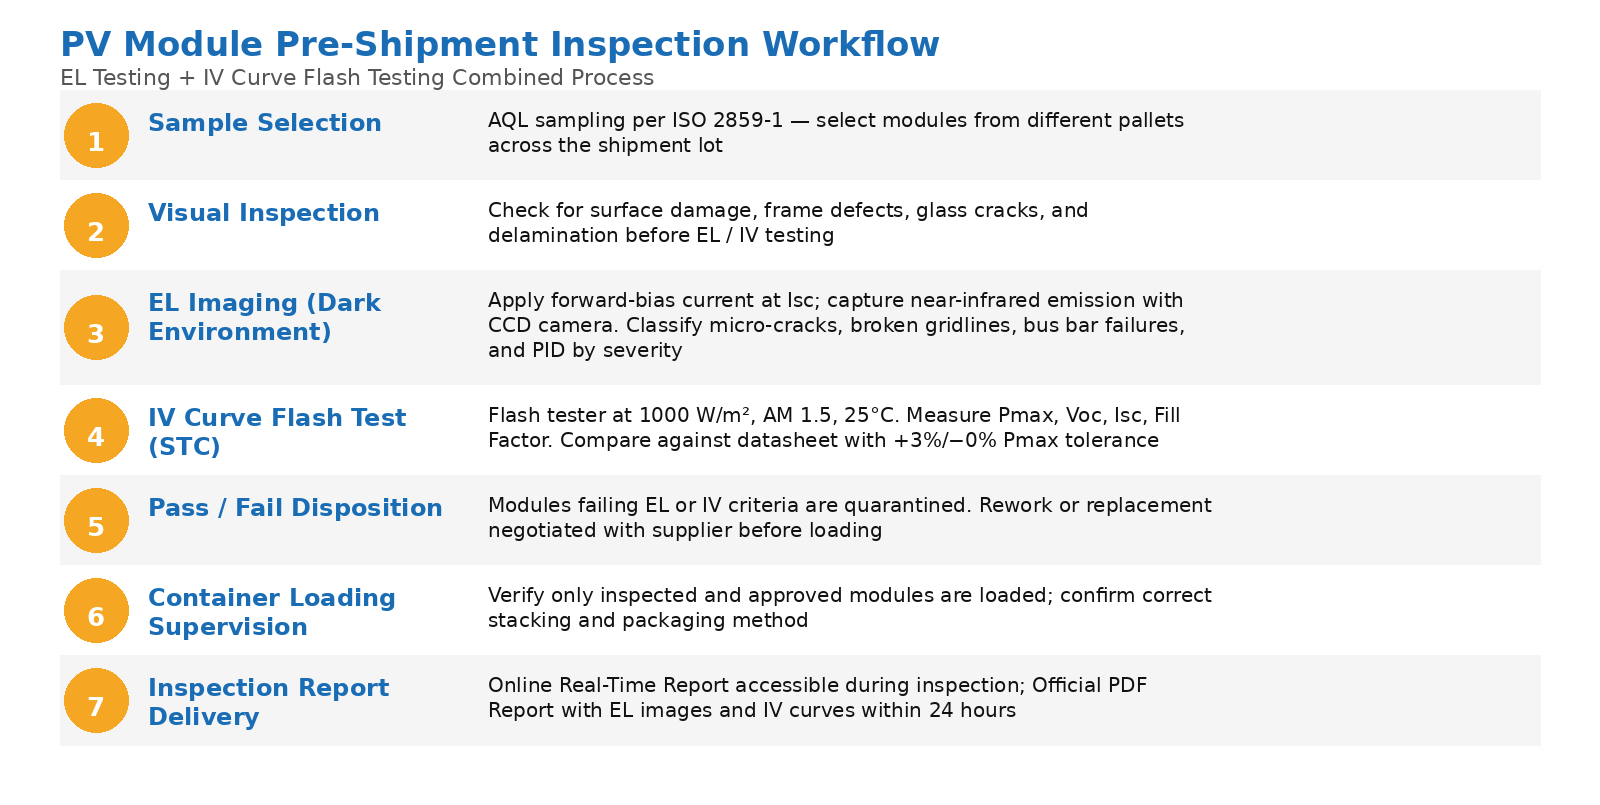
PV module pre-shipment inspection workflow combining visual check, EL imaging, and IV curve flash testing.
Inspection Method Comparison
| Inspection Method | What It Detects | Detects Micro-Cracks? | Detects Power Shortfall? | Destructive? |
|---|---|---|---|---|
| Visual Inspection | Surface damage, frame defects, delamination | No | No | No |
| IR Thermal Imaging | Hot spots, active cracks, bypass diode failures | Partial (active cracks only) | Indirect only | No |
| EL Testing | Micro-cracks, broken gridlines, bus bar failures, PID, inactive cell areas | Yes | Indirect (structural issues) | No |
| IV Curve Flash Test | Pmax shortfall, Voc/Isc deviation, low Fill Factor, IV curve irregularities | No | Yes | No |
What to Specify in Your Inspection Brief
Buyers commissioning a PV module pre-shipment inspection should specify several parameters in advance. For EL testing: the crack classification criteria to be applied (including which crack types are rejection-level versus observation-level), the required camera resolution, and whether the inspection should include 100% EL or AQL sampling. For IV testing: the Pmax tolerance (+3%/−0% is standard buyer-side), the AQL level and corresponding sample size, and whether Fill Factor or Isc deviations should trigger additional holds. Defining these parameters before the inspection — not during — is what produces an actionable report.
What Buyers Get from a Pre-Shipment EL + IV Inspection Report
Report Contents and Usability
A properly structured pre-shipment EL and IV inspection report should deliver specific data outputs. For EL testing: high-resolution EL images for each inspected module with defect annotations, classification of detected defects by type and severity, a summary table showing the number of modules per defect category, and a clear pass/fail disposition against the agreed acceptance criteria. For IV testing: the measured IV curve for each tested module with key parameter values (Pmax, Voc, Isc, FF), comparison against datasheet specifications and the buyer's tolerance, and a statistical summary of Pmax distribution across the sample.
The combination of these two data sets gives buyers something structurally valuable: a documented record of module condition at the time of shipment. If modules arrive at the installation site with damage, the pre-shipment EL images establish the baseline condition when the goods left the factory — critical evidence for warranty claims and for determining whether damage occurred in transit or was pre-existing.
TradeAider's pre-shipment inspection service delivers both an Online Real-Time Report accessible during the inspection and an Official PDF Report within 24 hours. For buyers managing large PV project shipments, the real-time access allows remote review of EL images and IV curve data as the inspection proceeds — enabling buyers to give instructions to the inspector on the factory floor without waiting for the final report.
When Pre-Shipment EL and IV Testing Is Most Critical
High-Stakes Sourcing Scenarios
Not every PV module order carries the same inspection risk profile. The scenarios where EL and IV testing add the most value are: first orders from a new supplier, where the manufacturer's internal quality processes are unverified; large-volume orders where a systematic quality issue could affect hundreds of modules; projects in remote locations where post-installation replacement is logistically complex; and orders from manufacturers with a history of power shortfalls or handling damage during packing.
For buyers who are also managing a factory audit as part of their supplier qualification process, the combination of a Factory Audit to verify the manufacturer's quality management system and a pre-shipment EL/IV inspection to verify individual batch quality provides end-to-end supply chain coverage. The factory audit tells you whether the supplier's processes are capable of producing consistent quality; the pre-shipment inspection tells you whether that capability was actually applied to your specific order.
Frequently Asked Questions
Can micro-cracks form after EL testing passes at the factory?
Yes — this is one of the most important reasons to conduct EL testing at the pre-shipment stage rather than relying on the manufacturer's own end-of-line EL data. A module that passes factory EL testing before packing can develop new cracks during palletization, stacking under excessive weight, or rough handling during warehouse movement. Pre-shipment EL testing conducted after final packing and before loading captures damage that occurred in the post-production handling phase. For buyers concerned about in-transit damage, combining pre-shipment EL with container loading supervision that verifies proper packaging and stacking methods provides the strongest protection.
What is the difference between EL testing and IR thermal imaging for PV modules?
EL testing detects structural defects within the silicon cell by making inactive cell areas visible through current-induced light emission — it works in dark conditions with current injected into the module. Infrared (IR) thermal imaging detects temperature differentials on the surface of an operating module under sunlight, showing hot spots where energy is being dissipated as heat rather than converted to electricity. IR imaging can detect active, power-affecting cracks and bypass diode failures, but it cannot see micro-cracks that are not yet causing sufficient heat to create a detectable thermal signature. EL imaging is more sensitive for early-stage and structurally significant cracks. The two methods are complementary rather than equivalent.
How many modules should be tested with EL and IV in a typical pre-shipment inspection?
The sample size depends on shipment quantity and inspection level. Using ISO 2859-1 at General Inspection Level II with AQL 2.5, a shipment of 500 modules requires a sample of approximately 80 modules; for 1,000 modules, the sample increases to around 125. Buyers with a lower risk tolerance should consider tightening to AQL 1.0 or requesting 100% EL with AQL-sampled IV testing. TradeAider's Inspection Charge Calculator can help estimate the cost of different inspection scopes for your shipment volume. To review what a completed PV module inspection report includes, see TradeAider's sample official reports.
Does a module that passes EL testing guarantee no power degradation over time?
No. EL testing captures the structural condition of the module at a specific point in time. It does not predict or prevent future degradation from UV-induced encapsulant browning, light-induced degradation (LID), potential-induced degradation (PID) in the field, or thermal stress from long-term cycling. What EL testing at pre-shipment does is establish that the module starts its service life free from significant pre-existing structural defects that would accelerate degradation or cause early power loss. It is one input into a complete quality assurance strategy, not a lifetime performance guarantee.
PV modules with hidden micro-cracks or power shortfalls cannot be detected by visual inspection alone — and they cause the exact performance gaps that damage project returns and complicate warranty claims. TradeAider's inspection service with a real-time report accessible during the inspection and an official report within 24 hours. Use the Inspection Charge Calculator to estimate costs for your shipment volume, or contact TradeAider to discuss the right inspection scope for your PV sourcing project.
Related Articles

Grow your business with TradeAider Service
Click the button below to directly enter the TradeAider Service System. The simple steps from booking and payment to receiving reports are easy to operate.