- About Us

- Our Services
- Your Industry
- Resources
- News & Blog
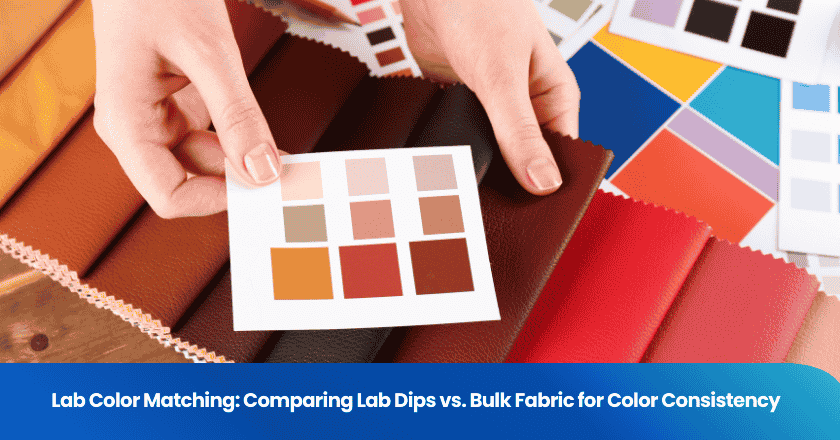
In the global apparel and textile supply chain, color accuracy is one of the most complex metrics to stabilize. Chromatic consistency is not merely a matter of visual preference; it is a technical science governed by spectrophotometry and chemical kinetics. The process of transitioning from a target color (lab dip) to large-scale production (bulk fabric) involves navigating multiple variables including liquor ratios, substrate absorption rates, and illuminant metamerism. Manufacturers and buyers must implement rigorous quality control systems to ensure that every lot produced maintains the spectral signature of the approved standard. This guide provides an in-depth technical analysis of lab color matching, the mathematics of Delta E tolerances, and the protocols required for industrial chromatic stability.
Key Takeaways
- Lab dips serve as the primary spectral standard, providing the dyeing recipe required for bulk scaling.
- Spectrophotometry using d/8 geometry is the industrial standard for measuring reflectance and capturing objective color data.
- Delta E (ΔE) 2000 is the most precise mathematical formula for calculating color difference perceived by the human eye.
- Metamerism occurs when two swatches match under one light source (e.g., D65) but fail under another (e.g., TL84 or UV).
- Effective quality checks during the dyeing process prevent "Shade Creep" across multiple production cycles.
- Substrate variables, such as fiber moisture regain and yarn twist, significantly impact dye exhaustion and final shade depth.
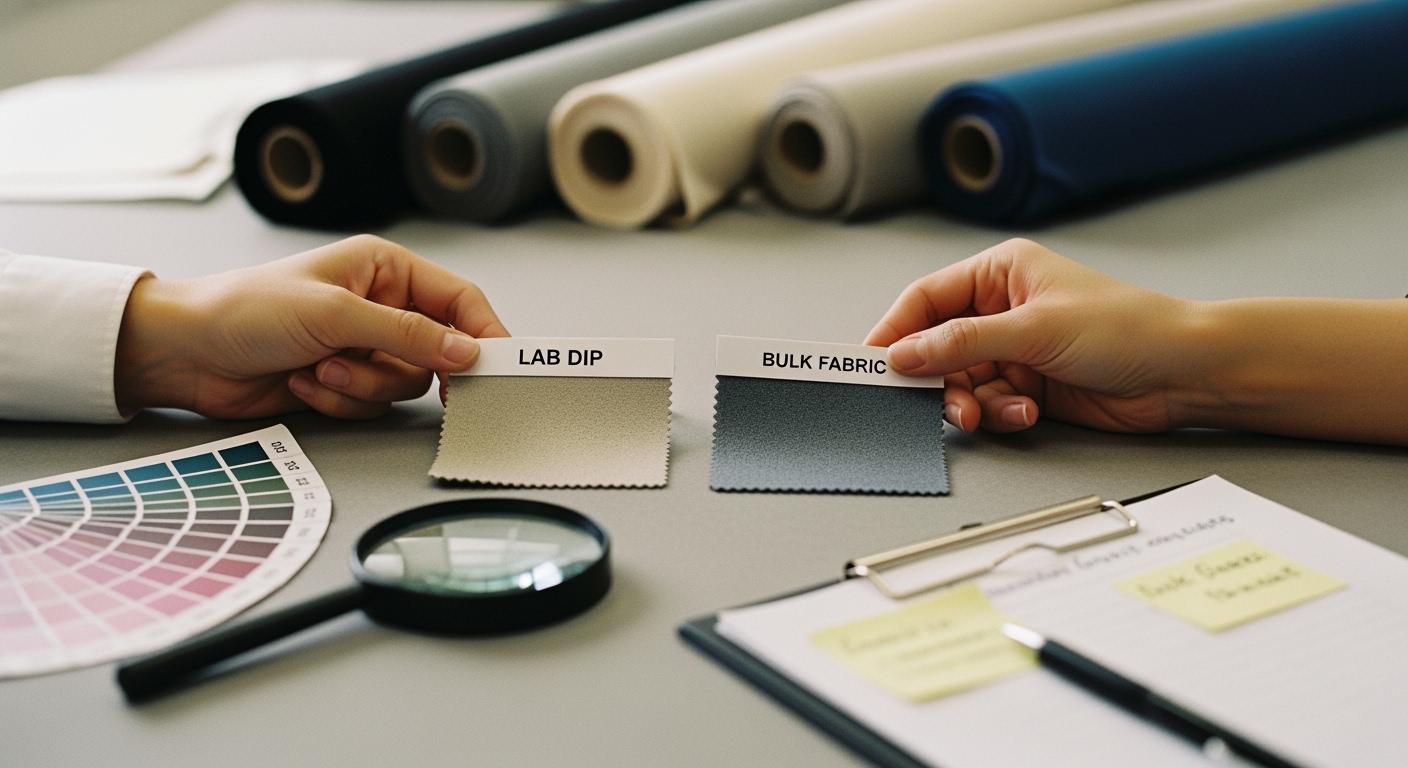
The Science of Colorimetry: Spectral Standards and Lab Dips
A lab dip is the small-scale physical manifestation of a digital color target. Technically, it is a 6-inch by 6-inch fabric swatch dyed in a laboratory beaker under controlled conditions. The primary goal of the lab dip process is to identify the precise combination of dyes (the recipe) that will yield the target L*a*b* values on a specific fabric substrate.
Spectrophotometer Geometry: d/8 vs. 45/0
Modern textile laboratories utilize spectrophotometers to eliminate human subjectivity. The industrial standard is the d/8 (diffuse 8-degree) sphere geometry. This instrument uses an integrating sphere to diffuse light evenly across the fabric surface, ensuring that texture and weave do not distort the reflectance data. During a pre-production inspection, the spectrophotometer provides the "Master Spectral Curve" which acts as the digital DNA for all subsequent production batches.
| Instrument Parameter | Technical Specification | Impact on Consistency |
|---|---|---|
| Illuminant | D65 (Daylight) / TL84 / A | Prevents metamerism across retail environments |
| Observer Angle | 10-Degree (Standard) | Mimics the focal range of the human fovea |
| Geometry | d/8 Sphere | Compensates for fabric surface gloss and texture |
| Aperture Size | > 8mm (MAV) | Averages out yarn-level color variation |
Delta E (ΔE) Mathematics: The Standard for Acceptance
In industrial dyeing, absolute perfection is impossible due to chemical variance. Therefore, the industry uses Delta E (ΔE) to quantify the distance between the target color and the production lot. While older systems used simple ΔE CMC (2:1), modern high-end brands require CIEDE2000 (ΔE 2000), which incorporates lightness, chroma, and hue weighting factors to better align with human perception.
Typical Acceptable Quality Limits (AQL) for Color
For most commercial apparel, a ΔE of 1.0 or less is considered an "Excellent Match." However, for high-visibility gear or luxury silks, the threshold may be tightened to 0.5. Conversely, for interior linings or hidden components, a ΔE of up to 2.5 might be acceptable. Professional quality assurance audits must define these limits in the tech pack before production begins.
Technical Insight: A common failure occurs when the L* (lightness) matches perfectly, but the a* (red/green) or b* (blue/yellow) values deviate. Even if the total ΔE is low, a shift in "hue angle" can make a garment look green under fluorescent store lighting.
Bulk Scaling Challenges: Liquor Ratio and Vat Dynamics
The most significant technical hurdle is the transition from a 250ml laboratory beaker to a 2,000kg industrial dyeing vat. This is governed by the Liquor Ratio (L.R.)—the ratio of the weight of the fabric to the weight of the water. In the lab, a ratio of 1:10 is common, but industrial jets may operate at 1:5 or 1:8. This change in liquor density alters the dye exhaustion rate (the speed at which dye moves from the water onto the fiber).
Variables affecting Dye Exhaustion:
- Temperature Gradients: Industrial vats may have "hot spots," causing uneven dye uptake across the length of the roll.
- Water Hardness: Calcium and magnesium ions in untreated water can inhibit dye fixation, leading to a "washed out" appearance.
- Substrate Pre-treatment: Inconsistent scouring (removing natural oils/waxes) creates areas of high and low dye affinity, resulting in "Shade Bars."
| Dyeing Phase | Laboratory Protocol | Bulk Industrial Variable |
|---|---|---|
| Heating Rate | Precise 1'C/min | Fluctuating based on steam pressure |
| Agitation | Magnetic stirring | Mechanical fabric flow and pressure |
| Water Source | Distilled/Deionized | Municipal water with variable mineral content |
| Sampling | Single immersion | Lot-to-lot yarn twist variations |
Detection of Metamerism: The Multi-Illuminant Audit
Metamerism is the most frequent cause of retail rejections. A garment may look identical to the sample in the factory under D65 daylight but appear drastically different under TL84 (European store lighting) or Illuminant A (Home incandescent light). This technical failure is caused by using different dye recipes that have the same color under one spectral power distribution but different reflectance curves.
During a thorough apparel inspection, inspectors utilize a Light Box (Viewing Booth) to perform a "Triple-Source Check." If the Metamerism Index (MI) provided by the spectrophotometer exceeds 0.5, the batch should be investigated for dye recipe correction.
Solutions for Chromatic Stability in Mass Production
To ensure bulk fabric color consistency, leading factories integrate real-time digital monitoring into their workflow. The following technical strategies are essential:
- Digital Standards (QTX Files): Instead of mailing physical swatches, brands send spectral data files directly to the dye house. This eliminates "Shade Decay" caused by physical swatch aging.
- On-Site Dye House Supervision: Monitoring the pH and liquor concentration every 20 minutes during the "exhaustion phase" of the dyeing cycle.
- Automated Dispensing Systems: Using computerized robots to weigh dyes to 0.01g precision, eliminating human error in recipe preparation.
- Continuity Testing (Shade Tapping): Taking samples from the beginning, middle, and end of the roll to check for "Side-to-Side" and "End-to-End" shading variations.
Conclusion: The Integrated Quality Assurance Approach
Reliable lab color matching is the result of technical discipline at every stage of the textile quality control process. By moving beyond subjective visual checks and adopting spectral metrology and Delta E 2000 math, manufacturers can significantly reduce the risk of costly re-dyeing and customer rejections. Digital traceability, supported by calibrated instruments and multi-illuminant audits, ensures that the chromatic fidelity of the bulk fabric matches the designer's original vision across all retail environments.
Ready to secure your product quality before shipment?
As your third-party inspection, testing & certification partner in China, TradeAider supports brands and sourcing teams across the entire production process, helping you identify quality risks early, ensure compliance, and strengthen your team’s capabilities before shipment.
Book an Inspection or Testing Service with TradeAider today, or for tailored solutions and expert guidance, contact us at services@tradeaider.com or submit the request form on the right. →
Frequently Asked Questions (FAQ)
What is the difference between a Lab Dip and a Strike Off?
A lab dip is for solid-colored fabrics, focusing on dye recipe and shade matching. A strike off is for printed or patterned fabrics, focusing on print alignment, screen registration, and the interaction of multiple colors on the substrate.
Why does polyester match better than cotton or wool?
Polyester is a synthetic filament with a uniform surface and low moisture regain, leading to highly predictable dye exhaustion. Natural fibers like cotton have varied cross-sections and high moisture sensitivity, causing more "lot-to-lot" variation.
How often should a spectrophotometer be calibrated?
For industrial use, a spectrophotometer should be calibrated using a "White Tile" standard every 8 hours or before every new batch measurement. Annual maintenance by the manufacturer is required to ensure the internal integration sphere has not yellowed.
Can I use a phone app for professional color matching?
No. Phone cameras use RGB sensors and lack a standardized light source and integration sphere. They are highly susceptible to "Glare" and "Ambient Light Interference." Only a dedicated spectrophotometer with d/8 geometry provides actionable data for industrial textile color matching.
What is the "Grey Scale for Staining"?
While color matching measures the shade, the Grey Scale measures color fastness. It determines if the dye will "migrate" or bleed onto other white fabrics during washing (ISO 105-C06) or rubbing (Crocking). A perfect lab dip is useless if it fails color fastness standards.
Related Articles
Grow your business with TradeAider Service
Click the button below to directly enter the TradeAider Service System. The simple steps from booking and payment to receiving reports are easy to operate.