- About Us

- Our Services
- Your Industry
- Resources
- News & Blog
Quality inspection tools help you ensure that products consistently meet strict quality standards. You rely on these tools to check dimensions, identify defects, and maintain high levels of customer satisfaction. In industrial settings, you often use quality inspection tools for several key reasons:
- Meet quality standards and comply with regulations
- Improve communication with material suppliers by identifying issues early
- Prevent human error and reduce waste
- Drive continuous improvement through real-time feedback
You typically encounter two main categories: physical measurement tools and analytical quality tools. Each category serves a specific purpose in helping you detect problems and maintain product excellence.
Key Takeaways
- Quality inspection tools are essential for ensuring products meet strict quality standards and customer satisfaction.
- Physical measurement tools, like calipers and micrometers, provide precise measurements, while analytical tools help analyze data and identify trends.
- Integrating multiple inspection tools enhances quality control, reduces human error, and supports continuous improvement.
- Regular calibration and maintenance of inspection tools ensure accuracy and compliance with industry standards.
- Comprehensive documentation and training for operators improve the effectiveness of quality inspections and foster a culture of quality.
Types of Quality Inspection Tools
Quality inspection tools play a vital role in maintaining product standards and ensuring process reliability. You use these tools to measure, analyze, and verify product quality at every stage of production. The two main categories—physical measurement tools and analytical quality tools—help you address different aspects of quality control.
Physical Measurement Tools
Physical measurement tools allow you to assess tangible product characteristics such as dimensions, surface finish, and hardness. You rely on these tools for direct measurement and defect detection. The most widely used physical measurement tools include:
- Cameras
- Sensors
- Ultrasonic testers
- Robotic arms
- Drones
- Machine vision systems
Machine vision systems, which combine high-resolution cameras, image sensors, and advanced software, help you identify defects, confirm product assembly, and ensure dimensional accuracy. In 2024, the machine vision segment accounted for over 47% of the market share, showing its dominance in automated quality assurance.
You often see these tools integrated into automated inspection lines. They provide fast, repeatable, and objective results. Physical measurement tools form the backbone of many quality inspection processes.
Analytical Quality Tools
Analytical quality tools help you interpret data and uncover trends in your inspection results. You use these tools to analyze patterns, monitor process stability, and identify root causes of defects. Common analytical quality tools include:
| Tool Name | Primary Use |
|---|---|
| Check Sheets | Data collection |
| Control Charts | Process monitoring |
| Histograms | Data distribution visualization |
| Pareto Charts | Prioritizing issues |
| Scatter Diagrams | Identifying relationships |
| Flowcharts | Mapping processes |
| Cause and Effect Diagrams | Root cause analysis |
You combine physical measurement tools with analytical quality tools to create a comprehensive quality inspection system. This approach enables you to detect issues early and drive continuous improvement.
Physical Quality Inspection Tools
Calipers
You use calipers to measure the dimensions of objects with high precision. These tools help you check thickness, diameter, and depth during inspection. You often choose between different types of calipers depending on your application. The table below shows the most common types and their typical measurement ranges:
| Caliper Type | Typical Measurement Range |
|---|---|
| Vernier Caliper | Up to 80"/2000MM |
| Dial Caliper | Resolution of 0.001" or 0.02mm |
| Digital Caliper | Varies, often includes iP67 models for liquid exposure |
You improve measurement accuracy by following best practices. Regular calibration ensures your digital calipers maintain their specified accuracy. Standardized measurement procedures reduce variability in your results. When you integrate calipers with quality management systems, you eliminate transcription errors and receive real-time feedback on measurement trends.
- Digital calipers typically offer a resolution of 0.001 inches or 0.01mm.
- Resolution indicates the smallest increment displayed, while accuracy reflects how close the measurement is to the true value.
Micrometers
Micrometers allow you to measure small dimensions with exceptional accuracy. You rely on these tools for tasks that demand tight tolerances, such as precision engineering. The table below highlights standard tolerances achievable with micrometers in various processes:
| Process | Standard Tolerance (inches) | Standard Tolerance (mils) |
|---|---|---|
| Milling | ±0.005” | ±5 mils |
| Turning | ±0.002” | ±2 mils |
| Drilling | ±0.005” | ±5 mils |
| Grinding | ±0.0005” | ±0.5 mil |
| Laser Cutting | ±0.0005” | ±0.5 mil |
You see micrometers used most frequently in industries where precision matters. Aerospace relies on micrometers for safety and performance. Automotive manufacturers need tight tolerances for parts and assemblies. Medical device makers use micrometers to ensure accuracy in critical health-related products.
| Industry | Reason for Use |
|---|---|
| Aerospace | Requires precision for safety and performance. |
| Automotive | Needs tight tolerances for parts and assemblies. |
| Medical Devices | Ensures accuracy in critical health-related products. |
Gauges
Gauges help you verify whether a part meets specified dimensions or tolerances. You use plug gauges, ring gauges, and snap gauges to quickly check if a component fits within acceptable limits. These tools provide a simple pass/fail result, making them ideal for high-volume inspection tasks. You often use gauges alongside other measuring instruments to confirm results.
Surface Roughness Testers
Surface roughness testers allow you to quantify the finish of a material’s surface. You measure parameters such as Ra, Rz, Rv, Rp, and Rt to assess the quality of machined or processed surfaces.
| Parameter | Description |
|---|---|
| Ra | The arithmetic mean of deviations from the mean line, universally recognized as the standard roughness parameter. |
| Rz | The height difference between the highest peak and lowest valley within a sampling length. |
| Rv | Maximum depth below the mean line within the sampling length. |
| Rp | Maximum height above the mean line within the sampling length. |
| Rt | Total peak-to-valley height within the evaluation length. |
You also consider additional factors such as density of peaks, arithmetic mean peak curvature, ten-point height of surface, five-point peak height, and five-point pit height. These measurements help you determine if a surface meets functional and aesthetic requirements.
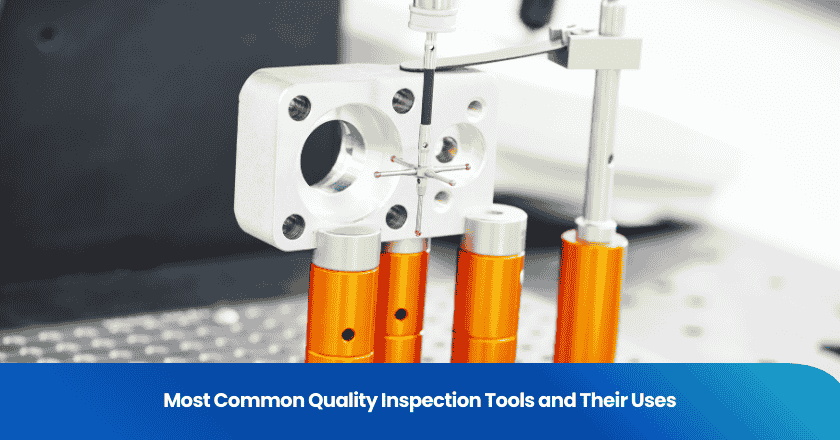
Coordinate Measuring Machines
Coordinate measuring machines (CMMs) provide you with automated, highly accurate measurement capabilities. You use CMMs to inspect complex parts by capturing precise coordinates of multiple points on a component. These machines help you verify geometric tolerances, dimensions, and alignment. You often use CMMs in industries where precision and repeatability are critical, such as aerospace and automotive manufacturing.
Visual Inspection Tools
Visual inspection tools enable you to detect surface flaws, dimensional discrepancies, and contaminants. You use magnifiers, microscopes, and computer vision systems to examine products closely. In electronics manufacturing, you rely on these tools to identify scratches, cracks, and abnormalities. The table below summarizes common visual inspection tools and the types of defects they detect:
| Tool Type | Defects Detected |
|---|---|
| Surface Inspection | Scratches, cracks, and surface flaws |
| Dimension Inspection | Size, shape, and orientation discrepancies |
| Computer Vision | Patterns, abnormalities, foreign bodies, and contaminants |
You enhance your inspection process by combining visual tools with automated systems. This approach increases detection rates and reduces human error.
Hardness Testers
You use hardness testers to evaluate the resistance of materials to deformation. These instruments help you determine if a material meets required specifications for strength and durability. The table below outlines the main types of hardness testers and their testing principles:
| Hardness Type | Testing Principle | Applications |
|---|---|---|
| Indentation Hardness | Measures depth of indentation under a static load | Common in CNC machining |
| Scratch Hardness | Assesses resistance to scratching | Used for minerals and soft materials |
| Rebound Hardness | Evaluates hardness based on rebound height after impact | Suitable for large and heavy materials |
| Microhardness | Tests small samples with precise loads | Ideal for thin films and coatings |
- Static methods gradually increase the test load, commonly used for metals.
- Dynamic methods apply an abrupt load, subjecting the specimen to impact.
You select the appropriate hardness tester based on your material and application. This ensures your products meet performance and safety standards.
Tip: Always use a measuring tape for quick checks of length and width before moving to more precise instruments. This practice saves time and helps you identify obvious discrepancies early in the inspection process.
Seven Basic Quality Tools
You rely on the seven basic quality tools to solve problems and improve processes in quality control. These tools, developed in post-World War II Japan, have become gold standards for quality evaluation. You see them used in methodologies like Six Sigma and Total Quality Management. Each tool helps you visualize, analyze, and address different aspects of process performance.
| Tool | Definition |
|---|---|
| Cause-and-Effect Diagram | Determines root causes of problems. |
| Check Sheets | Assists in gathering and organizing data systematically. |
| Control Charts | Measures process stability over time. |
| Histograms | Maps data distribution. |
| Pareto Charts | Identifies most important problem areas. |
| Scatter Diagrams | Indicates relationships between variables. |
| Flowcharts | Maps processes neatly. |
Check Sheets
You use check sheets to collect and organize data during inspection. These sheets allow you to capture observations in real time and sort them into categories. By using check sheets, you quickly identify patterns and trends in your data. For example, you might track the number of defects per shift in a manufacturing plant or record medication errors in a healthcare setting.
| Use Case | Description |
|---|---|
| Data Collection | Check sheets allow for systematic data collection in real-time, capturing observations in categories. |
| Pattern Identification | They help in identifying patterns quickly and impartially by converting observations into structured data. |
| Practical Examples | In manufacturing, they can track defects per shift; in healthcare, they can document medication errors. |
Tip: Use check sheets at the start of any quality control project to ensure you gather accurate and actionable data.
Control Charts
You use control charts to monitor process stability over time. These charts help you distinguish between normal process variation and unusual events. You plot data points on the chart and compare them to control limits. When a point falls outside the limits, you know that a special cause variation has occurred.
| Type of Variation | Description |
|---|---|
| Common Cause Variation | Natural, everyday variation inherent in any process, caused by many small, random factors. |
| Special Cause Variation | Unusual variation caused by specific, identifiable sources that are not part of the normal process. |
- Common cause variation always exists in your process.
- Special cause variation signals a change that needs investigation.
You use control charts to maintain consistent quality and to react quickly when a process shifts out of control.
Histograms
You use histograms to visualize the distribution of your data. By grouping data into intervals and displaying them as bars, you see how values spread across a range. This tool helps you identify patterns such as skewness, central tendency, or the presence of outliers. In quality control, histograms reveal whether your process produces consistent results or if you need to investigate further.
Note: Histograms make it easy to spot unusual patterns that might indicate problems in your process.
Pareto Charts
You use Pareto charts to prioritize quality issues. This tool combines bar and line graphs to show the frequency and cumulative impact of problems. The first bars are always the tallest, representing the most common sources of defects. The cumulative percentage line helps you decide which issues to address first.
| Evidence Description | Explanation |
|---|---|
| The few most significant defects make up most of the overall problem. | This highlights the essence of the Pareto Principle, emphasizing that focusing on a small number of issues can lead to significant improvements in quality. |
| The first bars are always the tallest, indicating the most common sources of defects. | This visual representation helps teams quickly identify which defects to address first. |
| The cumulative percentage line indicates which defects to prioritize. | This aids in decision-making by showing the cumulative impact of addressing specific defects. |
- The Pareto Principle states that 80% of results come from 20% of causes.
- You focus on the most frequent defect types to achieve the greatest improvement.
Scatter Diagrams
You use scatter diagrams to explore relationships between two variables. By plotting data points on a graph, you observe patterns that reveal correlations or trends. This tool helps you determine if changes in one variable affect another, which is essential for quality improvement projects.
- Scatter diagrams visualize relationships between two variables.
- They help you identify correlations and trends, enabling informed decisions.
- By observing the pattern of points, you assess the strength and direction of relationships.
Flowcharts
You use flowcharts to map out processes step by step. This tool helps you visualize the sequence of activities and identify potential bottlenecks or inefficiencies. Creating a flowchart involves several key steps:
1. Determine the purpose and scope of the flowchart.
2. Identify the steps and sequence of the process.
3. Choose the appropriate symbols and shapes.
4. Draw the flowchart.
5. Test and improve the flowchart.
Flowcharts give you a clear overview of your process, making it easier to spot areas for improvement.
Cause and Effect Diagrams
You use cause and effect diagrams, also known as fishbone or Ishikawa diagrams, to identify root causes of problems. This tool helps you organize possible causes into categories such as people, methods, machines, materials, and environment. By visually mapping out these factors, you systematically investigate and address the sources of defects.
When you use all seven basic quality tools together, you build a strong foundation for effective quality control. These quality control tools help you analyze data, monitor processes, and drive continuous improvement in your inspection activities.
Using Quality Inspection Tools Effectively
Integration for Comprehensive Quality Control
You achieve comprehensive quality control by integrating multiple inspection tools and technologies. Automation increases efficiency and accuracy when you test products for defects. Data analytics supports better decision-making and process improvement. You benefit from continuous improvement by auditing your inspection processes regularly. Advanced techniques, such as AI, robotic systems, and drones, help you minimize human error and enhance your inspection capabilities.
| Best Practice | Description |
|---|---|
| Automation | Automated systems improve efficiency and accuracy in defect identification. |
| Data Analytics | Data-driven technologies support informed decisions in quality control. |
| Continuous Improvement | Regular audits identify areas for process improvement and ensure compliance. |
| Advanced Techniques | AI, robotics, and drones reduce human error and expand inspection capabilities. |
Calibration and Maintenance
You maintain the reliability of your quality control tools by calibrating them regularly. Calibration frequency depends on how often you use each tester and the environment in which you operate. Not all equipment, such as a hi-pot tester or multimeter, requires annual calibration unless specified by your industry or customer. You should follow manufacturer recommendations and establish a documented calibration schedule. Regular calibration, at least annually, ensures your test results remain accurate and compliant with ISO standards.
- Calibration frequency varies based on usage and criticality.
- Manufacturer guidelines help you set proper calibration intervals.
- Documented schedules support compliance and customer satisfaction.
Documentation and Traceability
You strengthen your quality control system by maintaining coherent documentation and traceability. Effective data collection and analysis tell a clear quality story. You implement robust systems to manage records and quality events. Document relationship maps show connections within your quality system. Daily operational metrics align with inspection criteria, and investigation templates support thorough root cause analysis.
- Coherent documentation supports regulatory compliance.
- Traceability ensures you can track every test and inspection result.
- Clear records improve process improvement and customer satisfaction.
Training and Safety
You ensure operator readiness by providing comprehensive training for advanced quality control tools. Hands-on sessions, online tutorials, and user manuals accommodate different learning styles. You prioritize safety by teaching proper test procedures and equipment handling. Well-trained personnel reduce errors and improve the effectiveness of every inspection.
Tip: Regular training updates keep your team prepared for new technologies and evolving quality control standards.
You strengthen product quality when you understand and apply both physical and analytical quality inspection tools. Selecting the right tool for each inspection task supports a strong quality culture, formalizes procedures, and enables real-time monitoring.
- Continuous training and improvement enhance product quality.
- A quality management system sets clear rules for production.
- Industrial IoT improves defect detection.
| Benefit | Description |
|---|---|
| Streamlined processes | Identify inefficiencies and optimize workflows. |
| Improved efficiency | Achieve faster processes and reduce waste. |
| Enhanced product quality | Meet high standards and customer expectations. |
| Culture of continuous improvement | Foster ongoing enhancements in your organization. |
Keep refining your approach to quality control. You build a foundation for excellence and long-term success.
FAQ
What are the most common types of defects you find during quality inspection?
You often find surface scratches, dimensional errors, and incomplete assembly. These defects can affect product performance and appearance. Identifying defects early helps you prevent customer complaints and maintain high customer satisfaction.
How do quality inspection tools help reduce manufacturing defects?
You use quality inspection tools to detect defects at each production stage. Early detection of manufacturing defects allows you to correct issues before products reach customers. This process improves efficiency and supports customer satisfaction.
Why is it important to document defects during inspections?
You document defects to track trends and identify recurring problems. Accurate records help you analyze root causes and implement corrective actions. This approach reduces future defects and supports continuous improvement.
Can you use multiple tools to inspect for defects in one product?
You often combine several tools to check for different defects. For example, you might use visual inspection for surface flaws and calipers for dimensional accuracy. This method ensures you catch all possible defects and deliver reliable products.
How does defect analysis impact your quality improvement process?
Defect analysis helps you understand why defects occur. You use this information to adjust processes and prevent similar defects in the future. Effective analysis leads to fewer defects, better products, and higher customer satisfaction.

Related Articles


Grow your business with TradeAider Service
Click the button below to directly enter the TradeAider Service System. The simple steps from booking and payment to receiving reports are easy to operate.