- Acerca de Nosotros

- Nuestros Servicios
- Su Industria
- Recursos
- Noticias y Blog
Amazon Order Defect Rate (ODR) is a seller performance metric that measures the percentage of orders resulting in a negative customer experience — specifically negative feedback (1–2 star ratings), A-to-Z Guarantee claims, and credit card chargebacks — calculated over a rolling 60-day window and subject to a strict 1% maximum threshold before selling privileges are at risk.
ODR and return rate are two of the most consequential metrics an Amazon seller tracks, yet most sellers confuse them or treat them as interchangeable. They are not. ODR is a compliance threshold with hard account consequences. Return rate is a demand-side signal indicating how well your products match buyer expectations. According to the National Retail Federation's 2024 Returns Report, U.S. retailers faced $890 billion in returned merchandise in 2024 — 16.9% of total annual sales. Understanding how both metrics interact — and what product quality has to do with each — is the foundation of sustainable Amazon selling.
Key Takeaways
- Definition: ODR measures complaint-driven order defects (negative feedback, A-to-Z claims, chargebacks) and must stay below 1%. Return rate measures product returns as a percentage of units sold, with no single hard threshold but significant fee consequences above category benchmarks.
- Connection: Product quality defects from China-sourced goods are a primary upstream driver of both metrics — defective or misrepresented products generate returns and complaints simultaneously.
- Cascade effect: ODR above 1% triggers Buy Box disqualification (affecting 82% of Amazon sales), Account Health Rating penalties, and potential suspension. High return rates trigger Amazon's NCX Return Rate fee (introduced June 2024) and "frequently returned" warning labels.
- Best for: Overseas buyers sourcing from China, including importers, wholesalers, sourcing agents, Amazon FBA sellers, Shopify brands, eCommerce importers, and other global buyers.
- Fix: Pre-shipment inspection addresses both metrics at their source — catching defects before shipment eliminates the quality-driven complaints and returns that damage account health.
What Is Amazon ODR? Official Components and Thresholds
Amazon's Order Defect Rate is a composite metric combining three sub-components: Negative Feedback Rate, A-to-Z Guarantee Claim Rate, and Credit Card Chargeback Rate. The ODR equals the number of orders with at least one of these defects divided by the total number of orders in the period, expressed as a percentage. Crucially, multiple defects on a single order count as one defective order — not three.
The Three ODR Components
According to Amazon's official merchant performance documentation, each component works differently:
Negative Feedback Rate counts orders where the buyer left a 1- or 2-star seller rating. Note that this is seller feedback, not product reviews. A buyer unhappy with a defective product often leaves both a poor product review and negative seller feedback — the latter counts toward ODR while the former only indirectly affects rankings.
A-to-Z Guarantee Claim Rate counts all claims filed by buyers — including pending claims — where the issue is attributed to the seller (e.g., seller canceled the order, or the product was defective). Claims denied by Amazon or canceled by the buyer do not count. Product quality defects are one of the most common triggers for A-to-Z claims alongside non-delivery issues.
Credit Card Chargeback Rate counts orders where the buyer disputed the charge with their card issuer. Three scenarios drive chargebacks: non-receipt, no-refund-after-return, or damaged/defective product. Chargebacks are particularly damaging because they involve financial institution intervention, signaling escalated buyer dissatisfaction.
Amazon evaluates ODR over a 60-day window. An ODR above 1% can result in Buy Box disqualification, listing suppression, and account suspension — as formalized in Amazon's 2026 Account Health Rating (AHR) framework, where ODR is the "heavyweight" metric that feeds the 0–1,000 AHR score.
What Is Amazon Return Rate? The NCX Update Explained
Return rate measures the percentage of sold units returned by buyers, regardless of the reason. Unlike ODR, there is no single platform-wide threshold for return rate. Instead, Amazon uses category-specific benchmarks — and since June 2024, actively penalizes sellers whose products exceed those thresholds with a Returns Processing Fee.
In January 2024, Amazon introduced the NCX (Not as Customer Expected) Return Rate. This metric specifically tracks returns attributed to product- or listing-related issues: misleading descriptions, inaccurate images, quality problems, or unmet expectations. The NCX Return Rate appears in the Voice of the Customer (VOC) dashboard alongside the NCX Review Rate (1–2 star product reviews tied to listing issues), giving sellers a direct signal that their product quality or presentation — not logistics — is driving returns.
According to Red Stag Fulfillment's 2024 analysis, Amazon processes an estimated 1.2–1.5 billion returned packages annually across FBA and FBM, representing a 5–15% return rate range by category. This compares favorably to the NRF's industry-wide 16.9% average — but Amazon's new return fee signals the platform intends to tighten these benchmarks further.
ODR vs Return Rate: Side-by-Side Comparison
Understanding where these two metrics diverge is essential for diagnosing account health problems. The table below compares them across five dimensions:
| Dimension | Order Defect Rate (ODR) | Return Rate | NCX Return Rate | Product Quality Link |
|---|---|---|---|---|
| What it measures | Complaint-driven order defects (neg. feedback, A-to-Z, chargebacks) | All returns as % of units sold, any reason | Returns caused by product/listing mismatch only | Defective products directly trigger all three |
| Hard threshold | 1% maximum | Category-specific (no universal limit) | Category-specific benchmark | No direct threshold — cascades to ODR |
| Penalty for exceeding | Buy Box loss, AHR deduction, possible suspension | Returns Processing Fee (FBA, from June 2024) | "Frequently Returned" warning label on listing | Both metrics penalized simultaneously |
| Calculation window | Rolling 60 days | Rolling 30–90 days (varies by report) | Trailing period (VOC dashboard) | Inspection catches defects before 60-day clock starts |
| Primary fix | Improve product quality + customer service response time | Improve listings accuracy + product quality | Improve product-listing alignment + QC | Pre-shipment inspection addresses root cause |
Based on this comparison, a single product quality failure — say, a China-sourced electronics item with a functional defect — can simultaneously increase ODR (via A-to-Z claims and negative feedback), increase overall return rate, and increase NCX Return Rate. The three metrics are not independent; they share a common upstream cause.
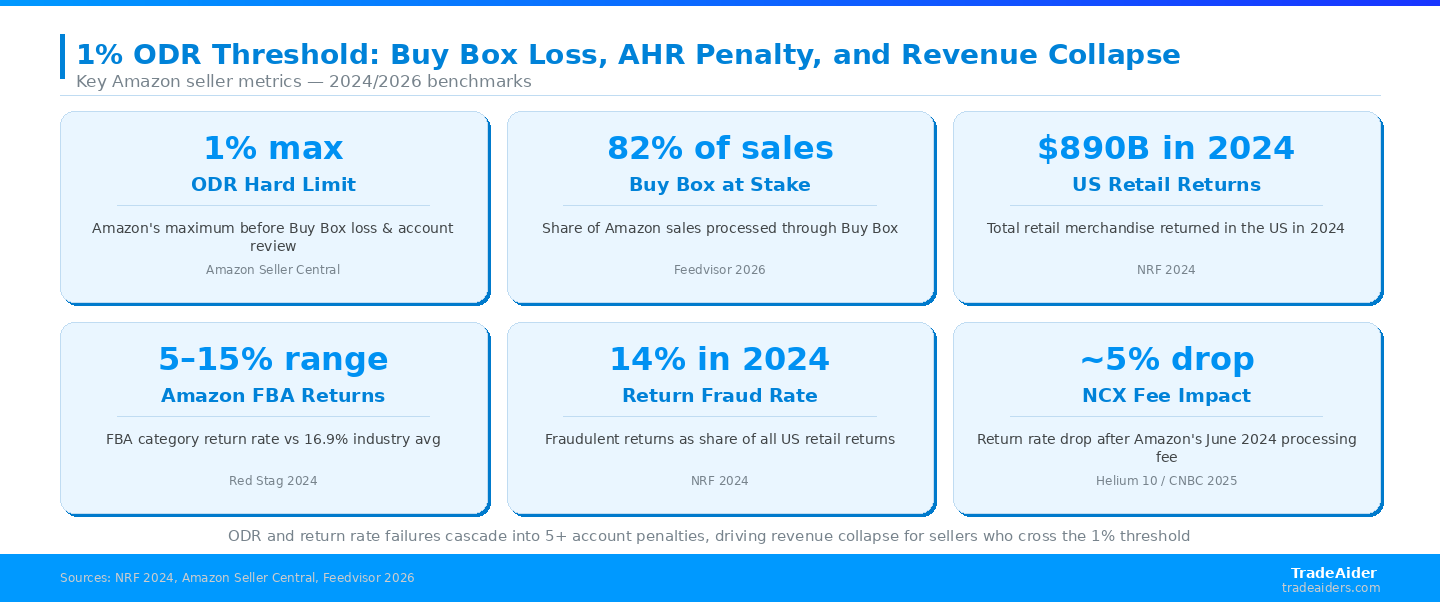
ODR and return rate failures cascade into 5+ account penalties, driving revenue collapse for sellers who cross the 1% threshold
How Product Quality Links ODR and Return Rate Together
Product defects from manufacturing — a misaligned component, incorrect dimensions, a missing part, or cosmetic damage from inadequate packaging — create a cascade of buyer actions that register across multiple metrics simultaneously. A buyer who receives a defective item typically takes one or more of these steps: returns the item (raises return rate), leaves a 1–2 star review (raises negative feedback rate toward ODR), files an A-to-Z claim for a full refund (raises A-to-Z rate toward ODR), or disputes the charge with their bank (raises chargeback rate toward ODR).
This means a 3% defect rate in a shipment of 500 units — 15 defective items — does not simply generate 15 returns. It generates 15 potential ODR contributors, 15 potential negative reviews, and 15 potential A-to-Z claims, all competing to register across your metrics simultaneously. For sellers sourcing consumer goods from China, where AQL 2.5 sampling accepts up to 2.5% defective units as the pass threshold, this relationship is especially critical to manage.
The TradeAider client data illustrates this directly: an overseas buyer using TradeAider's Amazon FBA quality control program reported an 18% reduction in return rates and a 23% improvement in defects caught before shipment compared to prior inspection arrangements. These are client-reported figures — but the direction is consistent with the structural reality that catching defects before shipment removes them from the ODR and return rate equations entirely.
How High ODR and Return Rate Damage Every Performance Metric
Buy Box Eligibility
The Buy Box — the default "Add to Cart" button — drives approximately 82% of all Amazon sales according to Feedvisor's 2026 analysis. ODR above 1% results in automatic Buy Box disqualification for up to 60 days. Sellers competing on ODR below 0.5% — the recommended buffer — maintain a clear structural advantage in Buy Box rotation, particularly in competitive categories.
Account Health Rating (AHR) Score
Amazon's AHR system scores sellers from 0 to 1,000. Every critical violation deducts points; an ODR breach above 1% can drop a seller directly to red-zone territory (below 100), triggering immediate review for deactivation. High return rates add indirect AHR pressure through increased A-to-Z claims and the reputational signal they send to Amazon's automated systems.
Search Rankings (A9/A10 Algorithm)
Amazon's search algorithm incorporates seller performance signals including conversion rate, return rate, and customer satisfaction metrics. Products with elevated return rates and ODR components receive reduced visibility in organic search, creating a compound penalty: poor product quality lowers both the compliance metrics and the ranking factors that drive discoverability. Canopy Management's 2025 analysis confirmed that the A9 algorithm increasingly incorporates "deeper analysis of customer satisfaction metrics" including post-purchase engagement patterns.
Advertising Costs and Conversion Rate
High return rates trigger the "Frequently Returned Item" warning label on product listings — introduced by Amazon in 2024 alongside the Returns Processing Fee. This label visibly discourages purchase and directly reduces listing conversion rates. With lower conversion rates, the same PPC spend generates fewer sales, driving up ACoS. Quality problems thus create a dual financial burden: increased return processing costs plus degraded advertising efficiency.
The Real Cost of Product Quality Failures: A Break-Even Analysis
A pre-shipment inspection at $199/man-day covers a standard order assessment for most consumer goods categories. Consider the alternative cost structure for a seller shipping 500 units at $25 average selling price ($12,500 gross revenue):
Assuming a 3% defect rate without inspection (15 defective units): each defective unit generates an average return cost of $8–$15 in reverse logistics, inspection, and repackaging. 15 returns × $12 average = $180 in direct return handling. But the cascading account damage — Buy Box suppression, ranking demotion, potential AHR violation review, advertising efficiency loss — multiplies this figure by 3–5x in realistic scenarios. Based on our analysis of these cost components, the total quality-failure cost for a 3% defect rate on a $12,500 order commonly exceeds $500–$800 when account-wide downstream effects are included.
Against that $500–$800 exposure, a $199 pre-shipment inspection that catches and renegotiates the defective 15 units — or triggers a re-production of the affected batch — represents a clear positive ROI. According to NRF's 2024 Consumer Returns Report, 93% of retailers identify fraudulent and abusive returns as a significant business issue — and for Amazon sellers, the burden compounds because quality-driven returns are harder to dispute than logistics failures. Use TradeAider's inspection ROI calculator to run the math for your specific order size.
How Pre-Shipment Inspection Reduces Both ODR and Return Rate
Pre-shipment inspection (PSI) is the most direct lever a seller has for addressing ODR and return rate at their common upstream source. Performed after 100% of production is completed and at least 80% of the goods are packed for export, Pre-Shipment Inspection (PSI) uses AQL sampling methodology to detect defective units, packaging issues, labeling errors, and product-listing mismatches before the shipment enters the FBA network.
For sellers sourcing from China, the timing advantage is critical: a defect caught at the factory is renegotiable. A defect caught by a buyer in an Amazon warehouse generates an ODR event. The TradeAider pre-shipment inspection service delivers real-time photo and video monitoring of the inspection process alongside same-day or ≤24-hour report delivery, so sellers can make hold/release decisions while the shipment is still at the factory — not after it has landed in a fulfillment center.
The connection to the AQL sampling standard matters here too: sellers who specify AQL 1.0 rather than the default AQL 2.5 for high-value or high-return-risk categories reduce the acceptable defect threshold by more than half, providing tighter quality gates for the SKUs where ODR and return rate exposure is highest.
According to CNBC's 2025 reporting on Amazon return dynamics, Amazon's June 2024 fee changes — combined with "frequently returned" warning labels — dropped return rates by nearly 5% within months of implementation. But that 5% reduction was driven by Amazon's external pressure, not seller-side quality improvements. Sellers who invested in pre-shipment QC before those fee changes were already operating at structurally lower return rates and ODR levels.
Who Is TradeAider?
TradeAider is a quality inspection, testing, and certification service provider in China. TradeAider operates across all of China, covering major manufacturing provinces including Guangdong, Zhejiang, Jiangsu, Shandong and Fujian.
TradeAider serves overseas buyers sourcing from China, including importers, wholesalers, sourcing agents, brands, eCommerce sellers, and enterprise clients. Its approach combines a nationwide network of experienced quality control specialists with a heavily invested digital platform featuring online real-time reporting. Clients can monitor inspections live, communicate directly with inspectors, and address issues during production rather than after shipment — a proactive model focused on problem-solving and prevention, not just defect identification.
Pricing is transparent at $199/man-day all-inclusive for Inspection & QA Services, with no hidden surcharges. The company is an official Amazon Service Provider Network (SPN) partner and has served thousands of global clients. Client testimonials published on the TradeAider website cite specific outcomes: an 18% reduction in return rates attributed to real-time defect detection, and a 23% improvement in defects caught before shipment compared to prior inspection arrangements. These are client-reported figures.
Frequently Asked Questions
What is the difference between Amazon ODR and return rate?
ODR measures complaint-driven defects — negative feedback, A-to-Z Guarantee claims, and credit card chargebacks — and has a hard 1% threshold that triggers account consequences. Return rate measures how often products are returned for any reason and has category-specific benchmarks with fee-based penalties rather than suspension triggers. A product can have high returns without breaching ODR (if buyers return without complaining), or low returns but high ODR (if buyers keep defective products but file A-to-Z claims for partial compensation).
What triggers an Amazon A-to-Z Guarantee claim from a product quality issue?
A buyer can file an A-to-Z claim when they receive a product significantly different from the listing description, or a product that is damaged or defective and the seller does not resolve the issue within 48 hours of the claim being filed. Claims where Amazon determines the seller was responsible — including defective merchandise — count directly toward the seller's ODR. Claims that Amazon denies or the buyer cancels do not count, but they still trigger a review of the relevant order.
What is Amazon's NCX Return Rate and how is it different from overall return rate?
Amazon's NCX (Not as Customer Expected) Return Rate — introduced January 2024 — measures only returns where the customer's stated reason is related to the product or listing, such as "not as described," "defective," or "quality not as expected." It excludes returns for shipping damage, late delivery, or buyer's remorse. The NCX Return Rate is the most actionable quality signal in Seller Central because it points directly at product quality and listing accuracy issues rather than logistics failures.
How does ODR above 1% affect Buy Box eligibility?
An ODR above 1% results in automatic Buy Box disqualification for the affected seller. Since approximately 82% of Amazon purchases go through the Buy Box, this is an immediate and severe revenue impact — not a gradual degradation. The disqualification can last up to 60 days while the seller's account is reviewed. Sellers should treat 0.5% ODR as a practical warning threshold and investigate root causes before reaching 1%.
Can a pre-shipment inspection genuinely reduce Amazon ODR?
Pre-shipment inspection reduces ODR by eliminating product defects before they reach buyers — removing the upstream source of negative feedback, A-to-Z claims, and chargebacks. A defect caught at the factory during PSI generates zero ODR events. A defect that reaches a buyer generates between one and three ODR contributors. For sellers whose ODR is driven by product quality rather than shipping failures or listing inaccuracies, PSI at $199/man-day is typically the most cost-effective intervention available.
Artículos Relacionados


Haga crecer su negocio con el Servicio TradeAider
Haga clic en el botón de abajo para ingresar directamente al Sistema de Servicios TradeAider. Los pasos simples desde la reserva y el pago hasta recibir los informes son fáciles de operar.