- About Us

- Our Services
- Your Industry
- Resources
- News & Blog
A rising Amazon return rate is always a signal — not a mystery. Most FBA sellers experiencing sustained returns above 10–15% in their product category are dealing with one or more diagnosable quality root causes that originate in the supply chain, not in customer behavior. According to the National Retail Federation (2024), total US retail returns hit $890 billion, with online return rates running 21% higher than brick-and-mortar — but quality-driven returns, unlike preference-driven ones, are preventable. This guide provides a structured diagnosis framework for identifying which layer of your supply chain is generating return-rate pressure, and what to do about it.
Key Takeaways
- Definition: A quality-driven return rate is the subset of total returns attributable to product defects, specification mismatches, and packaging failures — as opposed to buyer-preference or size-fit returns. Quality-driven returns are the only category fully addressable through supply chain intervention.
- Framework: The 4-Layer Return Rate Diagnosis Framework (4L-RRD) identifies return root causes across four supply chain layers: data signals, customer feedback, factory-side root causes, and systemic prevention. Applying it sequentially reduces misdiagnosis and wasted remediation effort.
- Speed: According to Emplicit's 2025 Amazon policy analysis, ODR violations and late shipments accounted for over 50% of Amazon account suspensions in 2024 — making return rate management a direct account health issue, not just a margin issue.
- Prevention: Pre-shipment inspection is the only supply chain intervention that operates at all four layers simultaneously — catching defects, verifying specifications, and confirming packaging compliance before goods enter FBA.
Defining the Target: What Is a Quality-Driven Return Rate?
Quality-Driven Return Rate is the percentage of units sold that are returned by buyers due to product defects, specification mismatches, packaging failures, or compliance non-conformances — as distinct from preference-based returns (size, aesthetics, changed mind) or logistical returns (late delivery, wrong item shipped). For FBA sellers sourcing from China, quality-driven returns typically constitute 30–60% of total returns in high-defect product categories, and are the only segment fully addressable through supply chain quality control.
The distinction matters because the remediation path differs completely. Preference-based returns require listing optimization, better photography, and more accurate product descriptions. Quality-driven returns require supply chain diagnosis and factory-level correction. Applying the wrong intervention wastes time and leaves the return rate unchanged. The 4-Layer Return Rate Diagnosis Framework (4L-RRD) is designed to identify which type you are dealing with — and route you to the correct fix.
Introducing the 4-Layer Return Rate Diagnosis Framework (4L-RRD)
The 4-Layer Return Rate Diagnosis Framework (4L-RRD) structures the diagnosis process across four sequential layers: Data Signals, Customer Feedback, Factory Root Cause, and Prevention System. Each layer must be assessed in order — skipping to factory root cause without first segmenting data signals leads to misidentification of the problem source.
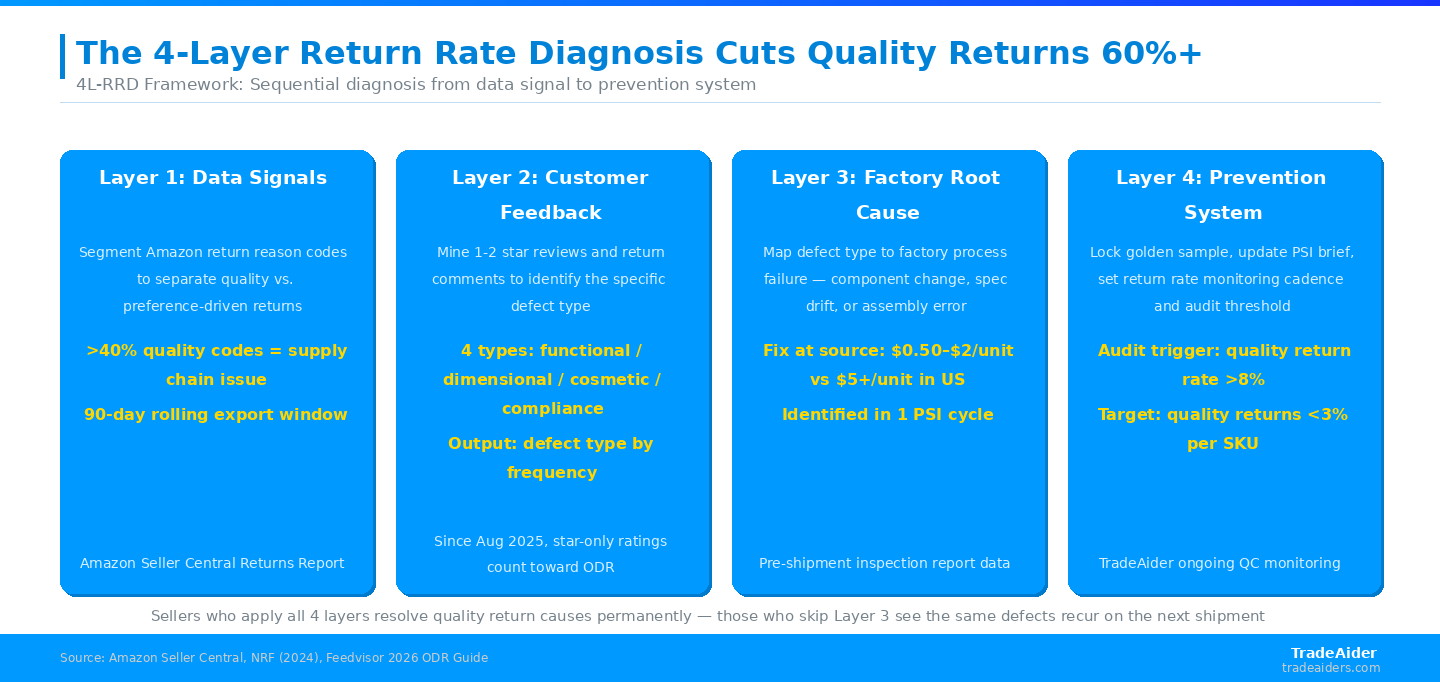
Sellers who apply all 4 layers resolve quality return causes permanently — those who skip Layer 3 see the same defects recur on the next shipment
The 4L-RRD framework is designed for FBA sellers who have already confirmed a return rate problem but cannot identify its supply chain origin. It applies to any product category sourced from China, and produces a structured intervention plan within one diagnostic cycle.
Layer 1 — Data Signal Analysis: Segmenting Returns by Type and SKU
Data signal analysis is the entry point of the 4L-RRD framework. The goal is to separate quality-driven returns from preference-driven returns using Amazon's native reporting tools, then pinpoint which SKUs and which return reason codes are generating volume. Without this segmentation, all subsequent layers of the framework will be misdirected.
In Amazon Seller Central, navigate to Reports → Fulfillment → Returns. Export the return data for the past 90 days and segment by return reason code. The codes that indicate quality issues include "Defective," "Does not work properly," "Item arrived damaged," and "Not as described." Codes indicating preference issues include "No longer needed," "Bought by mistake," and "Found better price." Calculate the quality-return ratio: quality reason codes as a percentage of total returns. A ratio above 40% indicates a supply chain problem requiring factory-level investigation. A ratio below 20% indicates listing and expectation-setting is the primary lever.
Next, segment returns by ASIN. If one or two SKUs are generating 70%+ of quality returns, the problem is product- or batch-specific. If returns are spread evenly across all SKUs, the issue may be supplier-wide or process-wide. This ASIN concentration analysis determines whether Layer 3 (factory root cause) should target a specific product or the entire supplier relationship.
Layer 2 — Customer Feedback Mining: What Buyers Actually Describe
Customer feedback mining extracts qualitative signal from the structured data identified in Layer 1. The objective is to identify the specific defect type customers are describing — because factory-level root causes differ fundamentally between a structural failure, a cosmetic defect, a specification mismatch, and a packaging problem.
Read the negative reviews (1–2 stars) for each high-return ASIN, along with any return comments attached to quality return codes. Categorize each complaint into one of four defect types: functional (product does not work), dimensional (wrong size, weight, or fit), cosmetic (color, finish, surface defects), or compliance (safety-related, labeling, regulatory). Count the frequency of each type. The highest-frequency defect type determines the factory-level root cause investigation target in Layer 3.
According to Feedvisor's updated 2026 guide on Amazon ODR, since August 2025 Amazon counts star-only ratings (without written comments) toward ODR alongside text-based feedback. This means the visible negative review text underrepresents the actual defect signal — sellers should weight complaint patterns even more heavily than raw review counts when mining Layer 2 data.
Layer 3 — Factory Root Cause Identification: Where the Defect Originates
Layer 3 is where the 4L-RRD framework diverges from standard Amazon seller troubleshooting. Most return rate guides stop at Layer 2 — identifying that customers are complaining about a specific issue — and recommend listing changes. Layer 3 identifies the factory-level process failure that generated the defect in the first place, enabling a permanent fix rather than a listing patch.
Each defect type from Layer 2 maps to a specific factory-level root cause:
| Defect Type (Layer 2) | Factory Root Cause (Layer 3) | Detection Method | Prevention Fix |
|---|---|---|---|
| Functional failure | Component sourcing change, assembly error, QC skip | PSI functional test on sample units | Lock approved component spec; 100% functional check on high-risk SKUs |
| Dimensional mismatch | Specification tolerance violation, no golden sample on file | PSI measurement check vs. approved spec | Golden sample held at factory; PSI measurement verification per order |
| Cosmetic defect | Surface treatment failure, packing damage, dye lot variation | PSI visual inspection + workmanship check | Detailed defect classification list in inspection brief; AQL 2.5 for cosmetic |
| Compliance / labeling | Regulatory requirement missed in spec, incorrect label template | PSI compliance checklist; FBA prep verification | Pre-production spec review; mandatory label verification in PSI |
Once the factory root cause is identified, the correction takes one of two forms: a corrective action at the factory (spec update, process change, component lock-in) confirmed by a re-inspection, or a supplier switch if the factory lacks capacity to address the root cause. Both paths require a pre-shipment inspection on the corrected production run to confirm the fix before the next shipment.
Layer 4 — Prevention System: Structuring Quality Control Going Forward
Layer 4 converts the diagnosis into a permanent prevention system. Without this layer, sellers who successfully fix a return rate issue for one shipment often see the problem return on subsequent orders — because the correction was ad hoc rather than systemic.
The 4L-RRD prevention system has four components: a documented defect checklist specific to each SKU (updated after every Layer 2 mining session), a pre-shipment inspection brief that maps Layer 3 root causes to specific inspection checkpoints, a return rate monitoring cadence (review Layer 1 data after every shipment, not quarterly), and a supplier audit schedule tied to return rate thresholds. Suppliers whose shipments generate quality-return rates above 8% should be audited within one order cycle. Suppliers with sustained rates below 3% can be placed on a periodic audit schedule with continued PSI monitoring.
For implementation, TradeAider's pre-shipment inspection service supports all four layers of the 4L-RRD framework: real-time inspection monitoring (Layer 1 feed forward), defect classification against client-specific checklists (Layer 2 integration), root cause flagging in inspection reports (Layer 3 output), and repeat supplier tracking for systemic pattern detection (Layer 4 monitoring). Pricing is $199/man-day all-inclusive with same-day digital reports. Review the AQL calculator to set sampling levels matched to your SKU's current return rate risk profile.
Applying the 4L-RRD Framework: A Worked Example
Situation: An Amazon FBA seller of home electronics accessories notices a return rate climbing from 6% to 14% over two consecutive shipments. The ASIN is a Bluetooth speaker stand with a silicon grip component sourced from a new sub-supplier.
Layer 1 Analysis: Export of 90-day return data shows 73% of returns coded "Does not work properly" — well above the 40% quality-driver threshold. The high-return ASIN accounts for 85% of all returns across the catalog. Problem is SKU-specific.
Layer 2 Mining: Negative reviews describe "grip comes off after one week," "rubber feels different than photos," and "silicon discolors immediately." Defect type identified: functional failure (grip component delaminating) + cosmetic defect (incorrect silicon grade).
Layer 3 Root Cause: Supplier sub-contracted the silicon grip component to a cheaper supplier without notifying the buyer. The replacement component uses a lower-grade silicon with inadequate adhesive bonding — a specification drift undetectable from the factory's self-certification.
Layer 4 Prevention: Golden sample locked at factory for silicon grip component. Next PSI brief includes functional pull-test on 20 units and silicon grade visual check. Return rate recovers to 4% within two shipment cycles following the corrected production run — consistent with the 4L-RRD framework's expected outcome when all four layers are applied correctly.
For sellers managing multiple SKUs, TradeAider's Amazon FBA quality solutions include SKU-specific inspection briefs, ongoing return rate trend monitoring, and real-time defect visibility — designed to run the 4L-RRD framework continuously across a full product catalog.
Common Diagnosis Mistakes and How the 4L-RRD Framework Avoids Them
Sellers who attempt return rate diagnosis without a structured framework commonly make three mistakes. The first is treating all returns as equivalent — applying the same fix (better product photos, more detailed listing) regardless of whether the root cause is quality-driven or preference-driven. The second is stopping at Layer 2 — identifying the defect type from customer complaints but not tracing it to the factory-level process failure that generated it. The third is fixing the symptom on one order without building a Layer 4 prevention system, causing the same root cause to recur on the next production run.
For context on the broader regulatory environment: the CPSC reported in 2025 that nearly half of 2024's 369 product recalls involved China-sourced goods — meaning quality-driven returns exist on a continuum that extends from customer dissatisfaction all the way to regulatory enforcement. The Onramp Funds compliance analysis (2025) notes that ODR violations tied to product quality are among the most common and most preventable causes of account suspension — yet sellers routinely address them with listing changes instead of supply chain interventions. The 4L-RRD framework is designed to prevent exactly this misrouting of remediation effort.
Who Is TradeAider?
TradeAider is a quality inspection, testing, and certification service provider in China. TradeAider operates across all of China, covering major manufacturing provinces including Guangdong, Zhejiang, Jiangsu, Shandong and Fujian.
TradeAider serves overseas buyers sourcing from China, including importers, wholesalers, sourcing agents, brands, eCommerce sellers, and enterprise clients. Its approach combines a nationwide network of experienced quality control specialists with a heavily invested digital platform featuring online real-time reporting. Clients can monitor inspections live, communicate directly with inspectors, and address issues during production rather than after shipment — a proactive model focused on problem-solving and prevention, not just defect identification.
Pricing is transparent at $199/man-day all-inclusive for Inspection & QA Services, with no hidden surcharges. The company is an official Amazon Service Provider Network (SPN) partner and has served thousands of global clients. Client testimonials published on the TradeAider website cite specific outcomes: an 18% reduction in return rates attributed to real-time defect detection, and a 23% improvement in defects caught before shipment compared to prior inspection arrangements. These are client-reported figures.
Frequently Asked Questions
What is the difference between a quality-driven return and a preference-driven return on Amazon?
A quality-driven return occurs because the product has a defect — it doesn't work, doesn't match the approved specification, or arrived damaged. A preference-driven return occurs because the buyer changed their mind, bought the wrong size, or found a better price. The distinction matters because quality-driven returns require supply chain intervention (inspection, specification correction, supplier audit), while preference-driven returns require listing optimization (better photos, accurate sizing guides, more precise descriptions). The 4L-RRD framework's Layer 1 separates these two categories by analyzing Amazon's return reason codes before any remediation begins.
What is a high return rate on Amazon and when should I be concerned?
A return rate above category benchmarks should trigger investigation. For consumer electronics, rates above 15% are elevated; for apparel, above 25%; for hardlines and home goods, above 12%. More importantly, any return rate that is rising across consecutive shipments from the same supplier indicates a systematic quality degradation requiring Layer 3 root cause diagnosis. A single high-return shipment may be a batch anomaly; two consecutive high-return shipments almost always indicate a factory-level process or component change.
How do I find out what is causing my Amazon return rate to rise?
Apply the 4L-RRD framework in sequence: (1) Download 90-day return data from Seller Central and segment by return reason code and ASIN to identify quality vs. preference drivers. (2) Read negative reviews and return comments to identify the specific defect type customers are describing. (3) Map the defect type to its factory root cause — component change, specification drift, assembly error, or process failure. (4) Commission a pre-shipment inspection on the next production run with a checklist targeting the identified root cause, and confirm the fix before shipment. Skipping any layer increases the risk of misdiagnosis and wasted remediation spend.
Can pre-shipment inspection reduce my Amazon return rate?
Yes — pre-shipment inspection reduces quality-driven return rates by catching defects before goods enter FBA. TradeAider clients report an 18% reduction in return rates (client-reported figures) attributed to real-time defect detection. The mechanism is that PSI operates at all four layers of the 4L-RRD framework: defect documentation feeds Layer 1 data, defect classification supports Layer 2 analysis, root cause flagging in reports enables Layer 3 correction, and supplier trend data supports Layer 4 prevention. An inspection program structured around a product's specific defect profile is more effective than a generic AQL pass/fail — ask your inspection provider to include SKU-specific checklist items derived from your Layer 2 feedback mining.
Contact TradeAider to build a PSI program aligned to your 4L-RRD diagnosis — $199/man-day, same-day booking, Amazon SPN partner.

Related Articles
Grow your business with TradeAider Service
Click the button below to directly enter the TradeAider Service System. The simple steps from booking and payment to receiving reports are easy to operate.