- About Us

- Our Services
- Your Industry
- Resources
- News & Blog
Inspection cost should be compared with the smallest number of avoidable return losses needed to cover it. That comparison is more useful than asking whether an inspection can eliminate every future customer complaint: it gives a seller a clear planning threshold while product, packaging, and shipment changes can still be corrected.
For an FBA order, the calculation starts with two disclosed inputs: the quoted inspection spend and gross loss per return, meaning the seller's estimate of unrecovered loss from one return that the planned check could avoid. Divide the first by the second, round up, and then compare the result with the named shipment. The result is not a forecast, a reimbursement estimate, or a promise of a marketplace outcome. It is a decision aid for deciding how much preventable loss would need to be avoided before the inspection spend is covered.
The sample plan supports a lot decision; it does not turn a sample result into a return-rate prediction. Applicable FBA preparation and product compliance requirements remain gates even when the financial threshold looks favorable.
Use a Threshold, Not a Promise
A break-even threshold tells a seller how many avoidable return losses must be prevented before inspection spend is covered. It is a deliberately narrow question: not whether every unit will perform perfectly, but whether a disclosed prevention effort has a plausible economic case for this shipment. A seller can calculate it before booking, revise it when the scope changes, and record the result beside the final release decision.
FBA lets sellers send products into fulfillment centers, where Amazon handles fulfillment, customer service, and returns. That operating model is one reason to evaluate preventable quality or preparation problems before inbound handoff. It does not tell a seller what one return will cost, however. Reimbursement, disposal, repackaging, replacement, advertising, and customer-acquisition effects can differ by product and situation.
Use the threshold as one part of a pre-shipment decision record. The record should identify the product version, carton group, inspection scope, sample rule, known changes, and the action that follows a pass, a failure, or an incomplete result. That turns an attractive ratio into something another person can review instead of a vague claim that inspection is always worth the spend.
- Use a seller-owned loss assumption rather than inventing a universal FBA fee.
- Round partial returns up, because 6.42 avoided returns is not an executable threshold.
- Test low, working, and high loss assumptions before treating one result as decisive.
- Do not let a favorable threshold override a failed quality, prep, documentation, or compliance gate.
Build a Return-Loss Input You Can Defend
Use the actual quoted scope as the inspection-cost input; the $199 calculation is an illustrative example rather than a standard service price. Quantity, SKU count, test points, packaging checks, travel, and the condition of the finished lot can change the actual scope. For a TradeAider booking, document those variables before comparing spend with the modeled loss. Then use an inspection cost calculator to record the cost side consistently.
Gross loss per return is the seller's estimate of unrecovered loss from one avoidable return, not a universal Amazon fee. A practical estimate can include the portion of product value not recovered, outbound and reverse handling that remains with the seller, replacement or refund exposure, packaging rework, and any internal service cost the business actually tracks. It should exclude amounts that are unknown or not causally linked to the inspected issue instead of silently inflating the number.
Make the assumption auditable by naming the condition it represents. For example, a glass product may use a modeled loss for an avoidable transit-damage return tied to a packaging defect. A textile seller may model the loss from a labeling or size-assortment error. Those are different mechanisms, so they should not share an unlabeled number simply because both appear in a returns report.
A useful worksheet has three rows for the loss input: a conservative low case, a working case, and a high case. Add a short note to each row explaining what changes. The low case might count only unrecovered unit and handling costs; the high case might additionally include documented replacement expense. This range prevents a fragile result built on one optimistic or pessimistic estimate.
Keep the input tied to the correct population. If only cartons packed before a documented insert change are at risk, use the number to assess that identified group. Do not apply the same ratio to later cartons merely because they are in the same purchase order. Traceability is what lets cost math support a bounded operational decision.
Calculate the Smallest Preventable Loss That Pays for Inspection
Acceptance sampling is a planned sample check that uses stated criteria to support a named lot decision. Acceptance sampling uses a random sample to support a decision about lot disposition, generally accept or reject. That is a different job from estimating future customer returns. The sample design should be agreed for the named lot and defect criteria, while the break-even model separately states the business loss assumption attached to a preventable issue.
A lot acceptance sampling plan is a sampling scheme and a set of rules for making decisions. Record both pieces, not just a sample size. The chosen sample level, defect classifications, tolerances, carton selection approach, and pass or hold action belong next to the financial calculation. An AQL calculator can help document the sample-rule side of that record.
Break-even avoided returns equal total inspection spend divided by gross loss per avoidable return, rounded up to a whole return. In notation: ceil(inspection spend / gross loss per avoidable return). The ceiling function matters because the spend is not fully covered until the next whole avoided loss occurs.
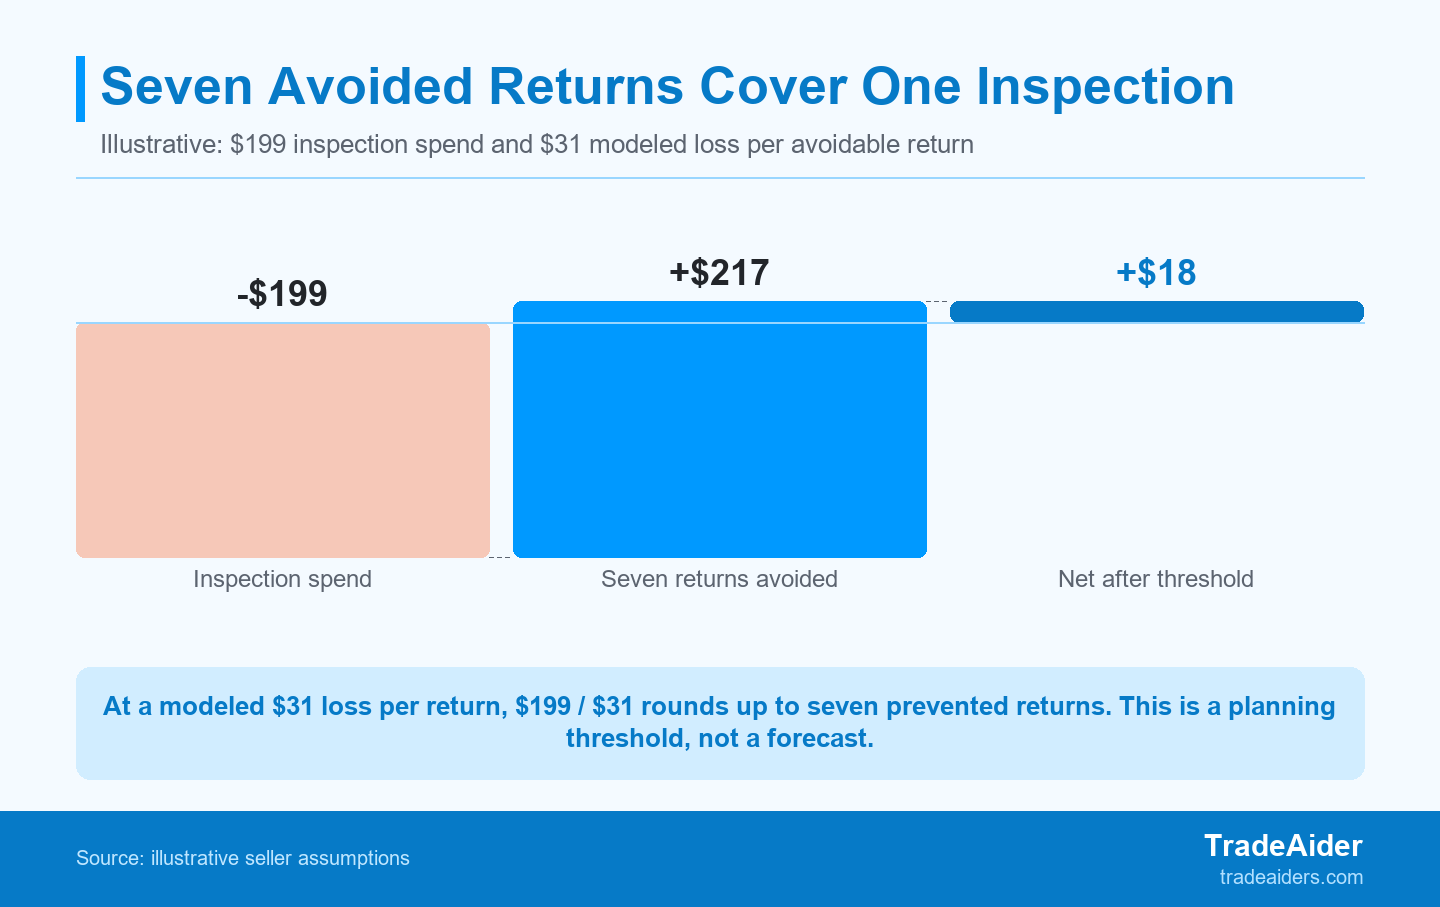
In this illustrative calculation, seven avoided returns at a modeled $31 loss each cover a $199 inspection spend; the inputs are planning assumptions, not a return-rate forecast.
Here is an illustrative calculation using seller assumptions, not an Amazon fee schedule or return-rate forecast. Suppose the inspection spend is $199 and the seller has modeled a $31 gross loss for each avoidable damaged-unit return. The arithmetic is $199 / $31 = 6.42. Rounded up, the threshold is seven avoided returns. On a 1,200-unit shipment, seven units equal 0.58% of the shipment. That percentage gives the buyer a scale check, not a probability that 0.58% of units will fail or be returned.
The next decision is operational: can the planned inspection and corrective process realistically address the stated mechanism before the goods move? If the inspection only observes a defect after goods are already committed, or if there is no time to rework an identified issue, the formula may still be mathematically correct but less useful for this order. Name the test point, sample frame, defect classification, and corrective action in advance. Also separate a correctable finished-lot condition from an issue whose financial effect cannot be isolated after handoff. Where the buyer needs a shared reference for the criteria, use the agreed inspection standards before confirming the check.
Test the Threshold Against the Shipment, Not Just One Assumption
NRF estimates that 19.3% of online sales will be returned in 2025. This is an online-retail benchmark, not an FBA, seller, ASIN, product-defect, or supplier return forecast. It may help a reader understand why return economics matter at retail scale, but it cannot supply the loss input or expected return rate for a named shipment.
A sensitivity table should show how the threshold changes when the loss-per-return assumption changes. The table below uses illustrative inputs only. It reveals the effect of assumption quality without implying that any column represents an Amazon charge, an expected defect rate, or a service outcome.
| Illustrative inspection spend | Modeled loss per avoidable return | Rounded break-even avoided returns | What the result means |
|---|---|---|---|
| $199 | $15 | 14 | A lower modeled loss needs more avoidable returns to offset the spend. |
| $199 | $31 | 7 | The working example reaches its whole-return threshold. |
| $199 | $50 | 4 | A higher documented loss lowers the count, not the need for evidence. |
| $398 | $31 | 13 | A larger scope must prevent more modeled losses before it is covered. |
Run the table against the actual count of units, cartons, and separately identifiable production groups. Then ask a more demanding question than “is the threshold small?”: what observation, correction, and verification step could prevent that number of losses? For a finished-lot inspection, the answer may be a packaging recheck, dimensional verification, label confirmation, or a hold for rework. Tie each observation to the relevant carton population and cutoff date so the response stays connected to the goods actually at risk. The relevant pre-shipment inspection service scope should make that connection explicit.
Keep Cost Math Below Product, Prep, and Compliance Gates
Proper FBA packaging, labeling, and preparation help avoid costly returns, repackaging fees, or refused shipments. The break-even model should therefore include the mechanisms the planned check can actually observe, such as packaging condition, required labels, carton marks, or count accuracy. It should not assume that a generic pass result proves all preparation requirements for every destination or product category.
Products subject to consumer product safety rules require certification, and covered children's products can have added testing and certification requirements. Applicability depends on the product and the relevant rules; this is general information, not legal advice. A financial threshold cannot replace required testing, documentation, certification, or a qualified compliance review.
For that reason, use the calculation below three gates. First, confirm that the product version and finished goods are the ones the inspection will cover. Second, confirm that any supplier correction can be verified before release. Third, identify category-specific requirements that need a separate evidence path. The check should identify the destination, labeling condition, packaging state, and documents that are in scope. It should also state who can authorize a hold when a requirement is missing. Sellers managing marketplace preparation alongside quality checks can coordinate these questions through Amazon FBA inspection support. Products with possible regulatory exposure need a testing plan matched to their category and destination.
Illustrative Scenario: A Late Packaging Change Alters the Decision
This illustrative case shows how a late packaging change can create a traceable cost boundary without proving a full-order outcome. It is a fictional planning example, not a reported client event or a return-rate forecast.
Why a Traceable Carton Group Can Support a Staged Decision
A staged release moves only the separately identified carton group that has passed its stated verification gate. The identified group must be verified, while the rest stays on hold. It does not certify the balance of the order by association.
Buyer context: A US home-goods seller is preparing a first FBA shipment of glass spice-jar sets from a Ningbo supplier.
Order context: The order contains 1,200 sets. Nine hundred were packed before a protective-insert revision, while 300 were packed after the revision.
Readiness state: The seller has a $199 inspection budget, a working inbound plan, and an internal $31 estimate for one avoidable damaged-unit return. The formula produces seven avoided returns, or 0.58% of the whole 1,200-set shipment. This is an illustrative cost example, not a client result or return-rate forecast.
Observation one: The supplier changed the carton insert after a transit concern, but the earlier 900-set group already carries printed FBA carton labels. The change record identifies the later group rather than showing that all cartons received the revision.
Observation two: A focused check finds chipped jars in the earlier packing group. The revised 300-set group has separate carton marks and an updated packing record, but that record alone is not a pass result.
Analysis: The seven-return threshold makes the inspection spend economically relevant, but it does not prove that every earlier carton will cause a return. The evidence gap is packaging condition by carton group. The right question is not whether the full order should move because seven is a small number; it is whether a separate, verified group can meet the agreed packaging gate.
Decision: Do not release the full shipment on cost math alone. Keep the earlier 900 sets on hold for rework or further verification. The revised 300 sets may move only after their carton marks, insert condition, set count, and agreed sample result meet the documented gate.
Corrective action: The supplier repacks the earlier group with the revised insert and updates carton-group records without mixing the two populations. The buyer retains the change record, packing list, and the inspection scope so a later reviewer can see which units were corrected.
Verification gate: Reinspect the repacked group for the agreed packaging condition, carton mark, and set count before it joins the FBA handoff. A failed or incomplete verification retains the hold; a pass supports only the scope that was actually verified.
Boundary: This illustrative example supports a staged decision for traceable carton groups. It does not certify unverified cartons, prove a full-order outcome, or predict future returns. Before final handoff, identify whether the product category has a separate testing, certification, or documentation requirement. Preserve the applicable evidence with the identified carton records rather than treating a packaging check as a substitute for every category-specific obligation. Where category evidence is required, build a separate product testing planning path before final handoff.
Run the Break-Even Check Before You Confirm Final FBA Handoff
A useful break-even check records scope, spend, loss assumptions, sample rules, and the release decision before final FBA handoff. The goal is a compact file that links a financial threshold to the physical lot and the action that follows.
- State the exact SKU, product version, carton group, finished quantity, and planned FBA handoff date.
- Insert the actual quoted inspection scope and the low, working, and high gross-loss assumptions for the named issue.
- Calculate and round up each threshold, then express it as a share of the relevant shipment or traceable sub-lot.
- Write the sample rule, defect criteria, packaging or label checks, and the corrective path available before release.
- Record whether the result supports release, staged release, reinspection, rework, testing escalation, or a hold.
Bring that record to the booking conversation rather than asking an inspector to infer the business decision after the fact. For a finished lot with stable product and packaging details, TradeAider can align the request with the SKU list, quantity, location, carton configuration, and the specific mechanism the check is meant to address. State whether a pass supports full release, a traceable partial release, rework, or a reinspection. That level of specificity keeps the result tied to a real release action and makes later change control easier to review. When those details are ready, Schedule your inspection.
Frequently Asked Questions
The FAQ gives general implementation guidance for a named shipment and does not guarantee a financial outcome. Use it to structure a decision record, then adapt the inputs and release gate to the actual product, order, and evidence available.
What formula should an FBA seller use to calculate inspection break-even?
Divide total inspection spend by gross loss per avoidable return, then round the result up to the next whole return. For example, $199 divided by a modeled $31 loss equals 6.42, which becomes seven whole avoided returns. Label both inputs as seller assumptions, state which preventable issue they relate to, and compare the output with the quantity in the relevant lot or carton group.
Should I use an industry return rate as my FBA inspection forecast?
No, because an industry benchmark can show scale but cannot predict your SKU, supplier, shipment, or specific defect mechanism. Build the threshold from your own inspection scope and recoverable-loss assumptions. Use external benchmarks only as context, and never convert a broad online-retail figure into a forecast for an ASIN or a named production lot.
Can a positive inspection result guarantee that I will avoid FBA returns?
No, because a sampling result supports a named lot decision and does not guarantee future marketplace outcomes for every customer. Its value depends on the sample plan, the observed product condition, the checks performed, and whether any corrective action was verified. Keep a pass result tied to the stated scope rather than extending it to uninspected cartons, later production, or different product versions.
When should a seller book a pre-shipment inspection for FBA?
Book when selected units, packaging, carton configuration, and key shipment details are stable enough to test and correct. Leave enough time after the check for corrective action, rework, and reinspection if needed. If a change occurs after the inspection, record what changed, which cartons it affects, and whether the new condition needs a separate verification gate before inbound handoff.

Related Articles
Grow your business with TradeAider Service
Click the button below to directly enter the TradeAider Service System. The simple steps from booking and payment to receiving reports are easy to operate.