

Supplier scorecards turn defined performance records into a consistent view of a supplier group. To identify its top 10%, first establish who is eligible, which measures count, how they are scored and what evidence is missing. The result is a ranking under those rules, not proof that the selected factories are the best everywhere.
A useful scorecard does more than select a winner. It explains where a supplier is strong, which weakness needs attention and whether improvement is sustained. Clear definitions and a reproducible calculation make that conversation more useful than either a purchasing impression or an unexplained total score.
What a supplier scorecard measures
A supplier scorecard is a structured record of performance against agreed measures over a stated period. It can combine quality, delivery, commercial accuracy and response to problems, while retaining the underlying observations. Data makes the comparison more traceable; people still choose the measures, priorities and decision rules.
Distinguish ongoing performance from initial capability. A factory assessment asks whether the site has the resources and controls needed for the product. A performance scorecard tracks how it actually handles relevant orders. Both matter, but a strong capability review cannot supply delivery history that does not yet exist.
Used well, scorecards help buyers target supplier development, discuss repeat failures and direct attention toward stronger performers. Sharing definitions also gives suppliers a basis to challenge incorrect records. These are management uses, not automatic guarantees of lower cost, better relationships or fewer disruptions.
Start with a comparable and eligible supplier group
Rank suppliers that are meaningfully comparable. Define the product family, process, specification, evaluation window and site being assessed. Record the eligible group before calculating its leading tier. A factory making a complex new item should not silently compete against a mature supplier making an easier product under different requirements.
Capability evidence helps establish eligibility. TradeAider’s factory audit covers agreed supplier information, production equipment, quality management, warehousing and specified requirements. Use those observations to answer the capability questions for the actual product and site.
ISO’s quality-management overview identifies ISO 9001 as a quality-management-system standard. Relevant system evidence is different from a product test or a record of current delivery performance. Keep those evidence types separate when deciding what a supplier has demonstrated.
Financial stability and applicable legal, environmental or labor requirements may also affect eligibility. Obtain the records and competent assessment appropriate to each question. An ordinary production assessment does not establish solvency or every compliance obligation. Mark unresolved eligibility separately instead of burying it in an average.
Define measures before collecting scores
Define each metric before collecting scores. Its numerator is the count of relevant outcomes; its denominator is the population or opportunities against which that count is measured. State the unit, period, desired direction, source owner and treatment of missing data. This prevents a label such as “quality” from changing meaning between suppliers.
For unit quality, NIST’s explanation of fraction nonconforming divides nonconforming items by the total number of items. An item that fails several relevant characteristics is still one nonconforming item. Counting defects instead would measure something different. Keep defect counts and defective-unit counts in separate fields.
- Quality: define first-pass acceptance, rework and repeat defects separately; preserve the inspection basis.
- Delivery: specify the agreed due event, such as dispatch or receipt, and whether the denominator is orders, lines or units.
- Cost and commercial performance: distinguish invoice accuracy, price changes and quality-loss costs. Correct invoices do not prove competitive total cost.
- Responsiveness: distinguish a quick acknowledgment from a verified correction completed by its due date.
- Innovation and collaboration: use a defined evidence-based rubric for agreed contributions; do not award points merely for attractive presentations.
Copy this record for each proposed measure: Name: ___; purpose: ___; unit: ___; numerator: ___; denominator: ___; evaluation window: ___; source and owner: ___; target and scoring direction: ___; missing/no-opportunity rule: ___. Have procurement, quality and the relevant data owner agree it before results are compared.
Select measures that change a decision. Several slightly different versions of delivery reliability can dominate a card without adding independent information. Conversely, a strategic development project may need a milestone measure that an established repeat-order supplier does not need; keep that cohort distinct.
Collect records that can be traced and corrected
Trace each reported value to its underlying order, inspection or transaction. The UK Government Data Quality Framework distinguishes completeness from accuracy and emphasizes data that is fit for purpose. Applied to supplier records, a fully populated spreadsheet still needs checks for incorrect values, duplicate entries and inconsistent definitions. This is a data-management lesson, not a supplier-scoring regulation.
Reconcile delivery records with the agreed due event and approved changes. Check invoice lines against the relevant order terms. For corrective actions, retain the finding, due date and evidence that closure was verified. A supplier’s status update should not automatically replace the buyer’s confirmation of an effective correction.
TradeAider pre-shipment inspection can contribute observations from specified sample-based product checks and reporting. Preserve the report’s product, lot, sample and criteria so the buyer knows which observations enter the quality measure. Combine them with the buyer’s operational records rather than expecting an inspection report to contain the entire scorecard.
Give suppliers a route to dispute errors, with an owner who checks the source and records any correction. Freeze a version for each review so a later data repair does not silently rewrite a past allocation decision.
Put metrics on a common scale and choose weights
Convert measures to a common scoring scale before combining them. Percentages, dollars, days and survey grades cannot be added directly as though they meant the same thing. Define whether a higher or lower value is better, then publish the conversion, targets and any caps.
For a lower-is-better measure such as delay duration, use a documented target-based scoring rule rather than adding raw days to a quality percentage. For a qualitative assessment, describe the evidence required for each rating. Normalization makes scales compatible; it does not erase differences in product mix, opportunity or measurement quality.
Weights determine how much a measure contributes to the total. The European Commission JRC’s weighting guidance explains that weights involve value judgments, can change rankings and should be transparent. It also warns about double-counting correlated indicators. Applied here, agree priorities with the people responsible for the purchasing decision rather than presenting a familiar formula as an industry rule.
A delivery-sensitive replenishment program may choose different trade-offs from a development program. Document why the selected weights fit that cohort, make them sum to the whole score and retain the version. Change them when the business purpose changes, with the reason visible to affected suppliers.
Keep nonnegotiable requirements outside the average
A high average can conceal an unacceptable weakness. JRC’s guidance on aggregation explains the compensating nature of an additive score: strong performance in one indicator can offset poor performance in another. That mathematical property matters when a buyer has a condition that cannot be traded away.
Keep applicable safety, legal and mandatory product conditions outside the compensating average. Define the evidence and authority needed to clear them, and hold or exclude an ineligible supplier as the policy requires. A low price or reliable delivery must not turn an unresolved critical condition into acceptable performance.
Show the eligibility decision alongside the score. This lets managers distinguish “strong performance within the eligible group” from “not currently cleared for this product,” and avoids assigning more business merely because the total looks attractive.
Illustrative example: rank ten eligible factories
This illustrative example uses hypothetical data, not client results. Ten factories are assumed eligible for the same product cohort and evaluation window. Each has 1,000 inspected units, 100 due delivery lines, 100 checked invoice lines and 20 due corrective actions. Denominators match across factories within each metric, not across different metrics. Q is first-pass accepted inspected units; D is on-time delivery lines; I is correct invoice lines; R is verified actions closed by their due date. All four are percentages where higher is better. I measures invoicing accuracy, not total cost competitiveness.
Assume the inspection basis and other metric rules are comparable. Calculate each percentage from its specified count. Keep first-pass acceptance separate from acceptance after rework, and use the same due-event definition for every delivery line. The table contains all inputs needed for the weighted sums.
The declared Q/D/I/R weights are 40%, 30%, 20% and 10%, chosen for this example. B has 96%, 99%, 98% and 95%, giving 97.2 points; A scores 96.8. Rank unrounded totals and display one decimal. The cutoff rule includes a tie at the boundary even if the selected share exceeds the target. Here B leads without a tie: one of ten is 10%.
Score = 0.40Q + 0.30D + 0.20I + 0.10R. For B: 0.40 × 96 + 0.30 × 99 + 0.20 × 98 + 0.10 × 95 = 97.2.
| Factory | Q (%) | D (%) | I (%) | R (%) | Score |
|---|---|---|---|---|---|
| B | 96 | 99 | 98 | 95 | 97.2 |
| A | 98 | 96 | 99 | 90 | 96.8 |
| C | 99 | 92 | 99 | 90 | 96.0 |
| D | 95 | 95 | 97 | 90 | 94.9 |
| E | 97 | 91 | 96 | 85 | 93.8 |
| F | 93 | 94 | 95 | 90 | 93.4 |
| G | 96 | 89 | 95 | 80 | 92.1 |
| H | 94 | 90 | 93 | 80 | 91.2 |
| I | 92 | 88 | 94 | 80 | 90.0 |
| J | 90 | 85 | 90 | 75 | 87.0 |
B leads this defined group under the declared model. That is enough to identify the example’s relative top tier. It does not establish spare capacity for the next order or a permanent quality designation. Before increasing allocation, check the particular product, capacity and requirements behind that decision.
Check whether the leader survives different priorities
Test plausible priorities before treating a small score lead as decisive. JRC’s sensitivity-analysis guidance examines how assumptions such as weighting, normalization, missing-data handling and aggregation affect composite results. For a supplier card, this means checking whether a reasonable alternative changes the decision.
Keep the hypothetical records unchanged and use alternative Q/D/I/R weights of 60%, 20%, 10% and 10%. A now scores 96.9, while B scores 96.7; C also scores 96.7. A becomes the leader. The change comes from priorities, not new factory performance. It does not establish statistical significance, and it does not justify choosing weights afterward to favor a preferred supplier.
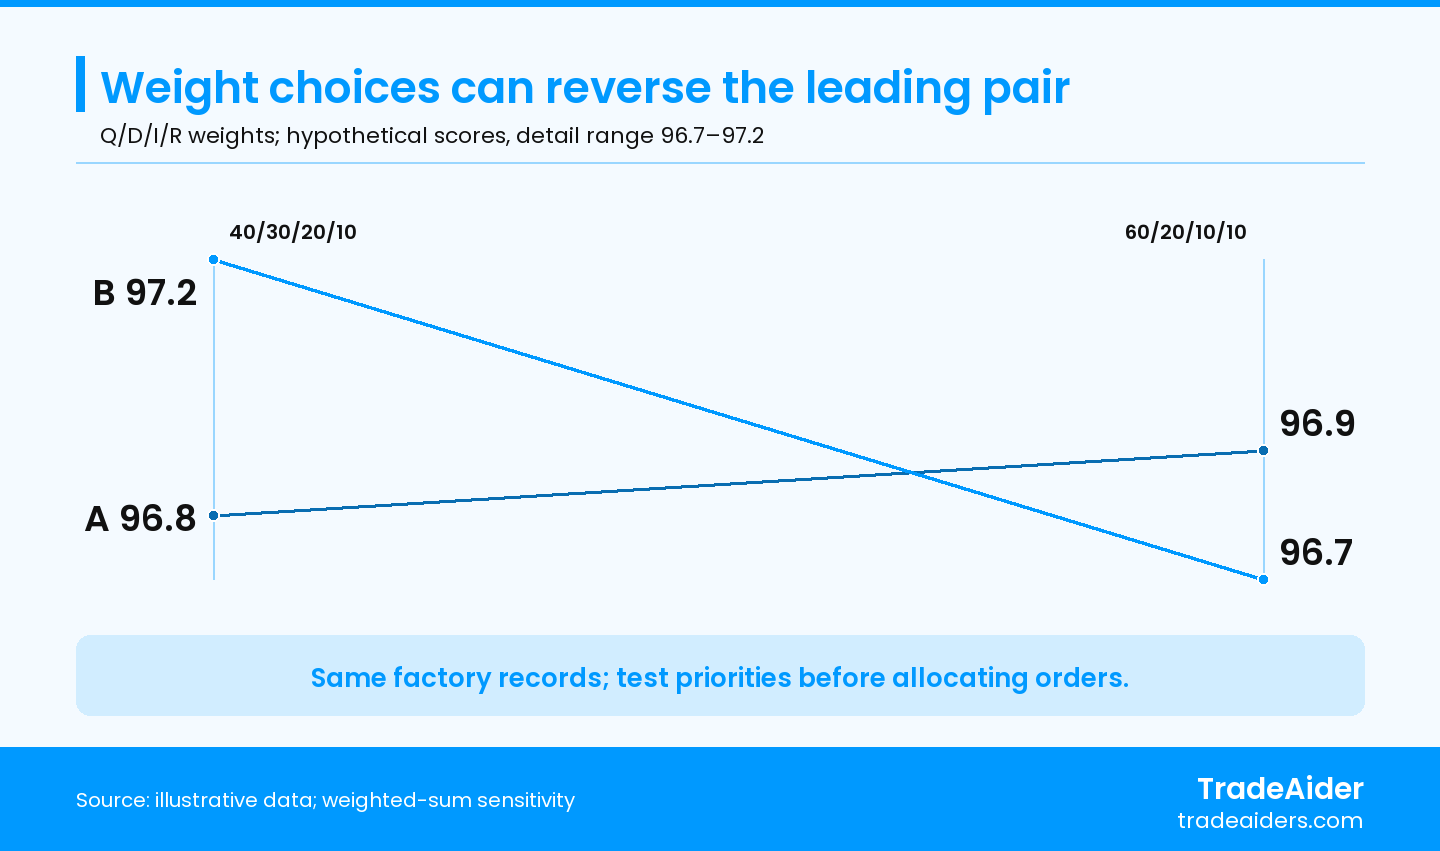
Hypothetical scores with unchanged input records; only the original leading pair is shown. With alternate weights, A leads all ten factories and B ties C below it. The detail range is 96.7–97.2; this is a scenario comparison, not a confidence interval.
If plausible choices reverse the leader, discuss the trade-off and review the underlying records before making a major allocation change. Report the result as sensitive to the model. A chart can make that reversal visible, but it cannot resolve which business priority the buyer should adopt.
Handle missing and unequal evidence openly
Treat missing evidence and no opportunity separately from poor performance. If a supplier has no corrective actions due in the window, its closure rate is undefined; automatically awarding full marks or zero changes what the measure means. Flag the reason, owner and next review, and apply a predefined provisional rule or a common reduced card for the comparable group. Do not silently remove a different metric and redistribute its weight for each supplier.
Also retain counts behind percentages. A rate based on a small opportunity count carries different information from one based on sustained activity. If inspection plans, product difficulty or order mix differ materially, separate the groups or obtain a defensible comparison rather than claiming that normalization alone makes them equal.
Lot decisions need particular care. NIST’s acceptance-sampling introduction identifies lot acceptance as the main purpose of acceptance sampling, rather than estimating lot quality. A percentage of lots accepted is not the same as the percentage of inspected units that conform, and neither should be relabeled as a proven population defect rate. Preserve the sampling basis when reporting quality.
When records cannot be aligned, show which comparison remains unresolved. The next action may be to repair the source, collect a comparable period or keep a new supplier provisional. An honest gap is more useful than a precise total built from incompatible observations.
Use the scorecard to improve supplier performance
Use score changes to start a specific improvement conversation. Choose a review cadence that fits order volume and risk, and review significant events between scheduled meetings. Share the underlying finding, agree an action owner and deadline, verify the correction and monitor recurrence. Keep formula versions, access controls and correction history when automating imports; automation does not establish that an input is true.
For example, falling on-time delivery should lead to examination of the affected lines and agreed dates. Distinguish supplier delay from a buyer-approved schedule change or an incorrect receipt entry. The remedy differs: production planning, a corrected record and an altered purchasing assumption are separate actions.
Give suppliers the definitions and evidence they need to respond. A corrective-action status should show what changed and how the relevant result was checked. Closing a task administratively is not enough if the same defect continues. Development resources can then follow the recurring problem rather than the lowest total alone.
Digital dashboards can bring purchasing, logistics and quality records together and flag new exceptions. Imported timestamps, RFID or GPS events still require a defined meaning and reliable association with the order. Blockchain preserves recorded entries; it does not establish the truth of the original observation. Assign owners to investigate exceptions and approve material changes to the card.
Before using the top tier for an allocation decision
- Confirm eligibility and a comparable cohort before naming a leading tier.
- Keep metric definitions, source counts and missing-data decisions visible.
- Review sensitivity and nonnegotiable conditions alongside the total.
- Use the ranking with actual product capability, capacity and order requirements when allocating business.
Connect factory evidence to your scorecard
Start a TradeAider inquiry with the product and order information available, the China supplier/site and the quality questions you need to resolve. Before service, agree relevant assessment or inspection criteria, checks and reporting. Combine the commissioned findings with your operational records in the scorecard. Contact our team to discuss a suitable scope and a report of the agreed observations.
FAQ
How can a small supplier pool have a top 10%?
State the actual selected share when the group is too small for an exact tenth. For five eligible suppliers, selecting one selects 20%, not exactly 10%. Declare the rounding or selection rule before ranking and report what it produces. “Highest-scoring eligible supplier” can be a more accurate description than an exact top-tenth label for a small group.
Can a newly audited factory enter the performance ranking?
Use a provisional qualification record until comparable operating evidence exists. An audit can support a capability decision, but it cannot create an order-performance history. Define the trial scope and the evidence needed to enter the established cohort. Keep the new site’s limited record visible so it does not receive an apparently equivalent ranking through assumed perfect values.
Should several sites in one group receive one score?
Keep site-level performance visible before deciding whether an aggregate is useful. Different sites may have different products, processes and responsibilities. Where aggregation is justified, combine matched underlying numerators and denominators rather than averaging percentages from unequal activity. Retain the site view so a large strong location does not conceal a problem at the site receiving your order.

Похожие статьи



Развивайте свой бизнес с услугами TradeAider
Нажмите кнопку ниже, чтобы войти непосредственно в систему услуг TradeAider. Простые шаги от бронирования и оплаты до получения отчетов легко выполнить.